

Ethereum price remained under heavy selling pressure for a fourth straight day on Friday as liquidations, sustained ETF outflows, and a major technical breakdown pushed ETH to its lowest level this year.
Summary
- Ethereum price dropped to a new yearly low near $1,680 as liquidations and ETF outflows weighed on sentiment.
- Spot Ethereum ETFs posted $19.3 million in inflows, ending a 17-day outflow streak.
- Analysts see $1,600 and $1,500 as the next key support levels after ETH lost $1,825.
According to data from crypto.news, Ethereum (ETH) price traded near $1,680 on June 5 after falling almost 5% on the day. The decline followed a sharp move below $1,825, a level traders had watched as one of the last major supports before the $1,600 and $1,500 zones.
Ethereum’s selloff accelerated after a crowded long trade unwound across crypto futures markets. CoinGlass data showed more than $1.2 billion in crypto positions were liquidated in a single day, with forced selling adding pressure to Ethereum as automated liquidation engines cut leveraged exposure.
Market sentiment also weakened after on-chain trackers flagged a movement of 10,422 Bitcoin, worth about $739 million, linked to the legacy Mt. Gox estate. The coins did not move directly to exchanges, but the transfer raised supply concerns across crypto markets.
At the same time, Strategy’s rare Bitcoin sale to fund preferred stock dividends added another psychological blow for traders already dealing with falling prices and thin liquidity.
ETF inflows offer limited relief
Spot Ethereum ETFs snapped their longest outflow streak on Thursday, recording $19.3 million in net inflows after 17 straight trading days of withdrawals, data from SoSoValue shows.
The inflow does not show a strong return of institutional demand, but it suggests the heavy bearish stance among professional investors may be starting to ease. Earlier in the week, Ethereum ETFs had suffered steep redemptions, including more than $519 million in outflows on June 2 alone.
Macro pressure remains another drag. WTI crude futures held near $93 per barrel on Friday, leaving oil up more than 6% for the week despite a 3% pullback in the previous session.
As reported by crypto.news earlier, the U.S. and Iran could still pursue a diplomatic solution, have helped calm oil markets, but talks have yet to produce clear progress. Israel’s military operations in Lebanon and Hezbollah’s rejection of a U.S.-mediated ceasefire proposal have kept geopolitical risk elevated.
Higher oil prices have revived inflation concerns at a time when the Federal Reserve is already maintaining a higher-for-longer stance. With the 10-year U.S. Treasury yield near 4.43%, investors have continued to move capital away from risk assets and into safer yield-bearing markets.
Ethereum chart keeps $1,500 in focus
Ethereum’s daily chart shows an inverse Adam and Eve structure that broke below neckline support near $1,975. The measured move from the pattern projects a possible decline toward roughly $1,412, placing the $1,500 area directly inside the next major downside zone.
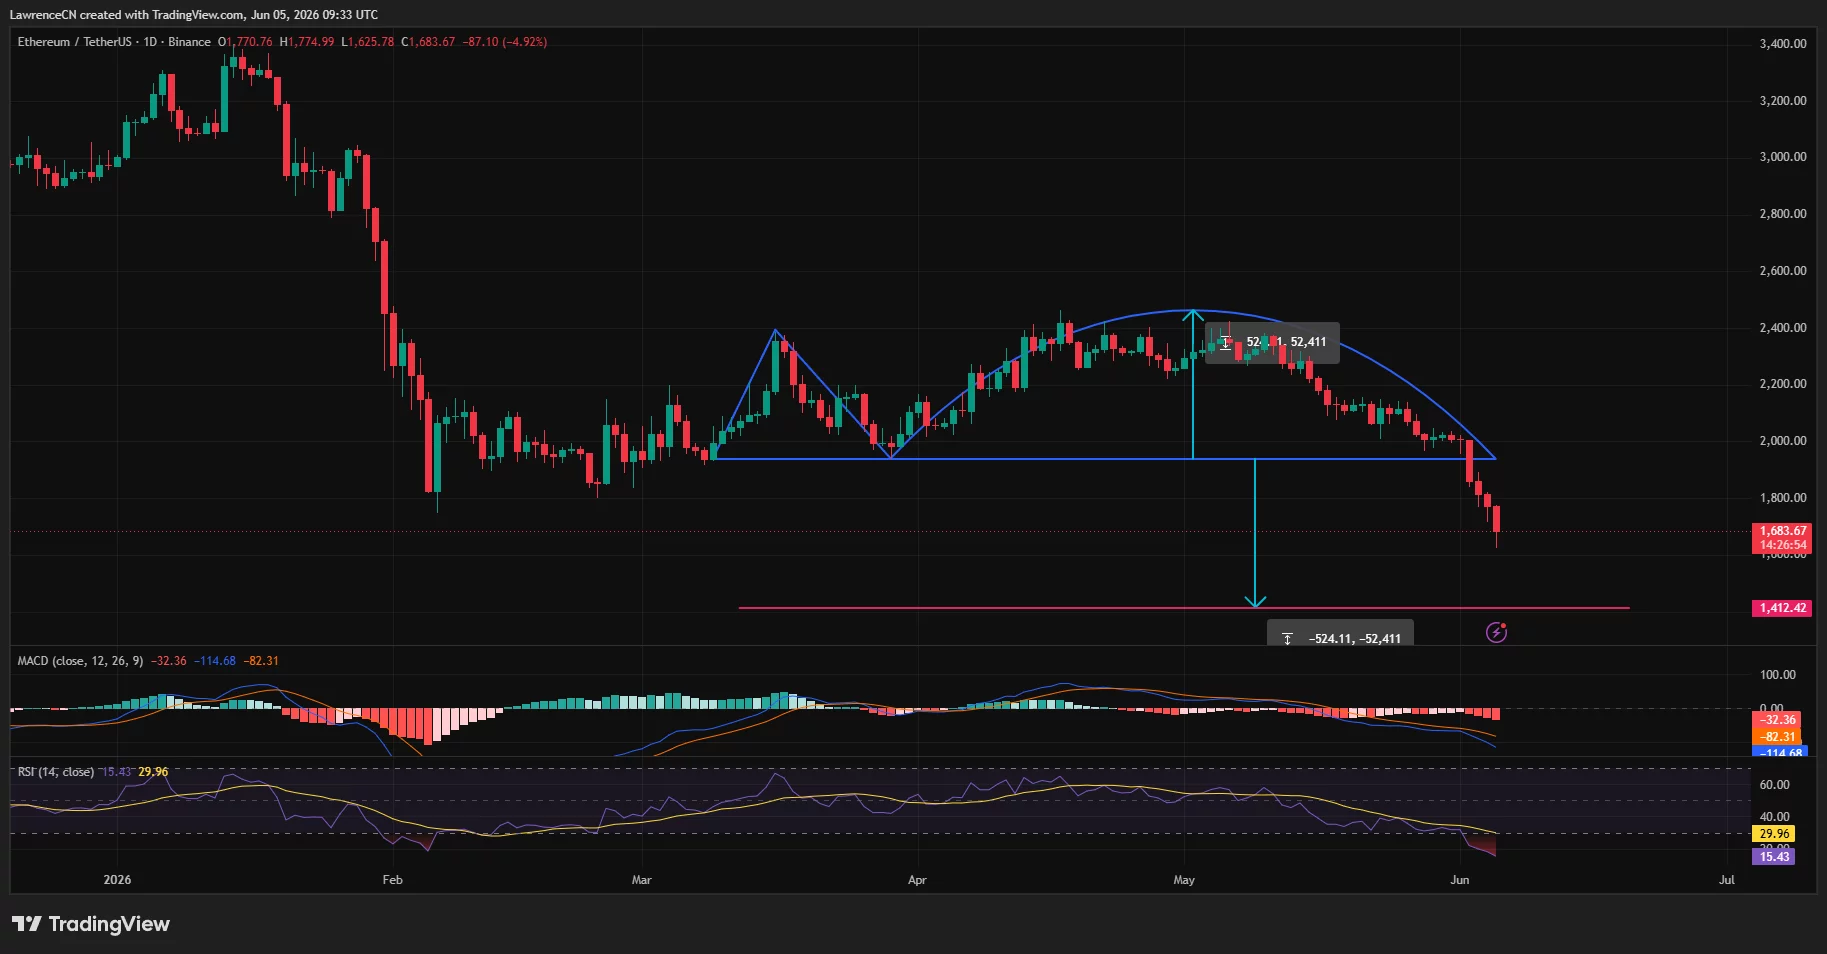
The breakdown also pushed ETH below its 200-day exponential moving average and local ascending support, turning the $2,030 to $2,245 area into a heavy resistance zone. A recovery into that band would be needed before bulls can challenge the bearish structure.
Momentum remains weak. The daily MACD sits below its signal line, while the histogram remains in negative territory. The 14-day RSI has fallen into deeply oversold territory, with the chart showing a reading near 15 and the RSI average near 30.
According to crypto analyst Ali Charts, Ethereum’s break below $1,825 has opened the next downside levels.
“Ethereum $ETH broke past the $1,825 support level! Now the path to $1,600 and $1,400 is open.”
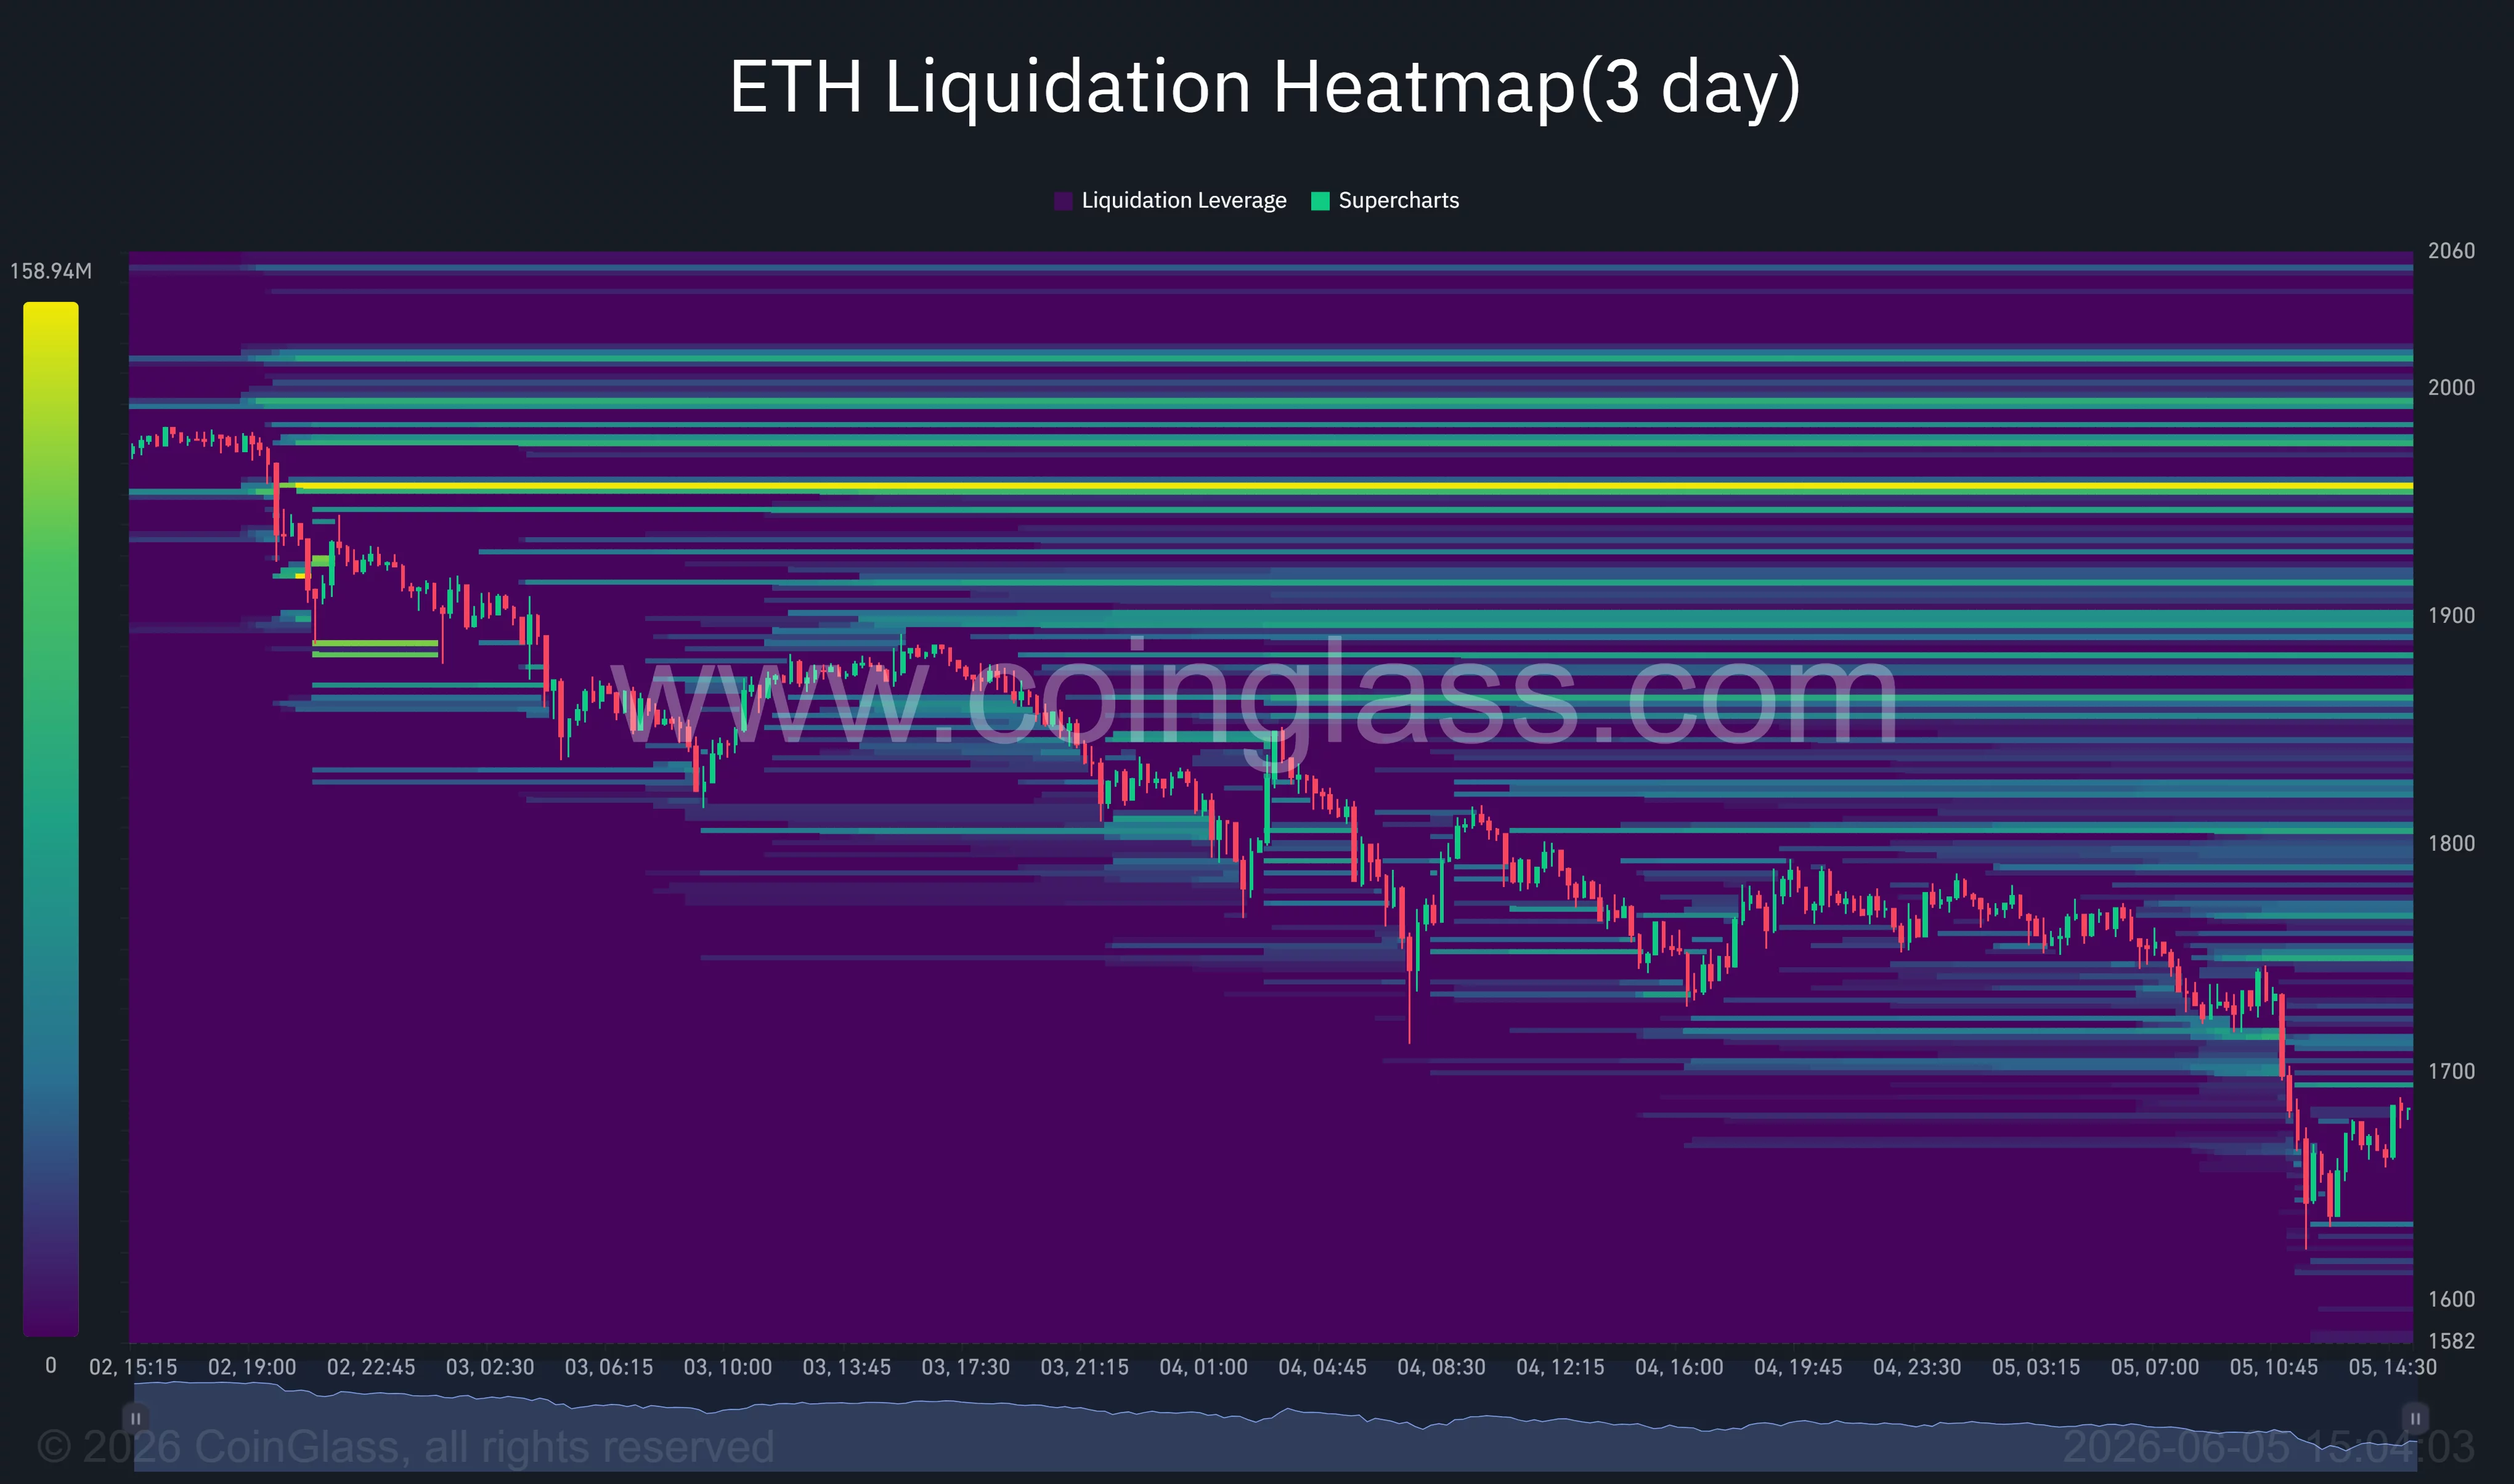
CoinGlass’ three-day liquidation heatmap shows heavy liquidation clusters above spot price, especially between $1,900 and $2,060. Below current levels, liquidity appears thinner until the $1,600 area, meaning a failure to hold the current rebound zone could leave ETH exposed to another sharp move lower.
Commenting on the latest price action, crypto trader Ted Pillows noted that Ethereum had dropped to a new yearly low and argued that the $1,500 level could become an accumulation zone for larger buyers.
Michael van de Poppe offered a more contrarian view, noting that Ethereum had reached its lowest daily RSI ever recorded. He described the extreme RSI reading as “close to the end of the bear market,” though price has not yet confirmed a reversal.
Downside risk would deepen if ETH loses $1,600 on strong volume. Such a move would place $1,500 and the measured target near $1,412 into focus, especially if liquidation pressure returns and ETF inflows fail to continue.
The bearish setup would begin to weaken only if Ethereum reclaims $1,825 and then closes above $1,975. Until then, $1,500 remains the key level traders are watching as the next major test of buyer demand.
Disclosure: This article does not represent investment advice. The content and materials featured on this page are for educational purposes only.