

Bitcoin traded near $79,200 on Sept. 9 after recovering sharply from its June low, supporting Wintermute’s broader argument that the current downturn has been shallower than the bear markets of 2018 and 2022.
Summary
- Bitcoin traded near $79,200 on September 9, roughly 37% below its October 2025 record high.
- Wintermute said Bitcoin reached a roughly 50% cycle drawdown versus 77% and 83% historically recorded.
- The current price is no longer 50% below the peak after August’s recovery rally unfolded.
- U.S. spot Bitcoin ETFs attracted about $987 million during their third consecutive positive week recently.
- August payrolls rose 162,000 while unemployment remained at 4.1% ahead of September’s Fed meeting decision.
The market maker said Bitcoin was about 50% below its peak roughly 340 days after the cycle high. It compared that decline with losses exceeding 75% at the same stage of the previous two major bear markets.
However, the 50% figure requires context. Bitcoin’s current price is not 50% below its record. It describes the approximate maximum drawdown reached during the current cycle, or a selected point in Wintermute’s cycle comparison.
At $79,200, Bitcoin was approximately 37% below the record above $125,600 reached in October 2025. The difference matters when assessing whether the market is still near capitulation or has already moved into a recovery phase.
Bitcoin’s current drawdown is smaller than 50%
Wintermute’s Sept. 7 update said Bitcoin’s major cycle bottoms had become progressively shallower. It cited declines of about 83% in the 2018 bear market, 77% in 2022 and roughly 50% during the current cycle.
Independent price data support the broad direction of that comparison. Bitcoin fell approximately 52.6% from its October 2025 record at the June 2026 trough, according to Hashrate Index’s historical analysis.
Bitcoin then closed July at $63,577, leaving it about 48.9% below the peak. Its August rally reduced the drawdown further as the price closed the month above $78,000.
The calculation based on the current price is straightforward. Bitcoin’s verified October 2025 record was approximately $125,653. A price of $79,200 represents a decline of about 36.97%, rounded to 37%.
Wintermute’s statement that BTC “sits 50% below peak” therefore does not describe the Sept. 9 spot price. The figure is better understood as the deepest drawdown reached earlier in the cycle or as a chart observation based on a different cutoff date.
The larger claim remains valid: the present cycle has not produced the 75% to 80% collapse seen after earlier peaks. Whether that proves structural market maturity remains open.
Shallower Bitcoin bottoms may reflect deeper liquidity
Wintermute attributed the smaller loss partly to exchange-traded funds and institutional investors entering earlier during market weakness. That explanation is plausible, but it cannot be confirmed through drawdown data alone.
U.S. spot Bitcoin ETFs recorded approximately $987 million in net inflows during the week ended Sept. 4. The result marked their third consecutive positive week and lifted inflows across that period to about $3.8 billion.
Daily flows remained uneven. The products recorded a large $731 million inflow on Sept. 3, followed by approximately $175 million on Sept. 4, according to Farside. They then recorded net outflows as the new week began.
The data show that regulated products provided meaningful demand during the recovery. They do not prove that ETFs established the June bottom or permanently reduced Bitcoin’s downside risk.
Market structure has nevertheless changed since 2018. Spot ETFs allow pensions, advisers, hedge funds and other investors to obtain exposure through traditional brokerage and custody systems. The products create an additional demand channel that did not exist during Bitcoin’s earlier bear markets.
Institutional participation can also work in both directions. ETF shares can be sold quickly, and large redemptions may increase pressure during risk-off periods. A broader investor base may deepen liquidity without eliminating severe drawdowns.
Wintermute also pointed to improving market breadth and rotation between investor groups. It said profits leaving mature trades were funding newer sectors, which it described as resembling a young market cycle.
That remains the firm’s interpretation. The rally has not spread evenly. Wintermute itself noted that artificial intelligence and decentralized physical infrastructure tokens outperformed while decentralized finance and Layer 2 tokens remained comparatively weak.
Bitcoin held firm after stronger U.S. payrolls
Bitcoin’s resilience was tested by the stronger-than-expected U.S. employment report. The Bureau of Labor Statistics said nonfarm payroll employment increased by 162,000 in August, while unemployment remained at 4.1%.
The official report showed employment gains in food services, local government education and manufacturing. Average hourly earnings increased 0.3% during the month and 3.1% from a year earlier.
The stronger labor data reduced expectations that the Federal Reserve would ease monetary policy soon. Bitcoin fell from approximately $82,400 to below $80,000 after the release but retained part of its weekly gain.
Wintermute viewed that response as evidence of underlying demand. It argued that crypto held up better than expected during a week when markets repriced the possibility of higher interest rates.
One market reaction does not establish a lasting break from macroeconomic conditions. Bitcoin remains sensitive to interest rates, bond yields, the U.S. dollar and liquidity expectations.
The U.S. Treasury also began increasing its long-term securities buybacks. The department raised the maximum size of operations involving 10-to-30-year nominal securities from $2 billion to at least $4 billion.
The change took effect Sept. 9 and will remain in place through Nov. 4, according to the Treasury’s official announcement. Buybacks may improve market liquidity, but they are not direct purchases of Bitcoin or a new monetary stimulus program.
Technical indicators show momentum cooling near $79,000
Bitcoin’s price recovered from its June low and moved above its 200-day simple moving average during the August rally. As crypto.news reported, Bitcoin approached $83,000 after reclaiming the long-term average.
The supplied chart showed the relative strength index at 62.18, below its moving average of 68.17. An RSI above 50 indicates positive momentum, while the decline from higher readings shows that buying pressure has cooled.
The MACD line crossed below its signal line, and the histogram fell to minus 436.98. Both main MACD lines remained above zero. This combination normally reflects weakening short-term momentum within a broader recovery rather than confirmation of a full bearish reversal.
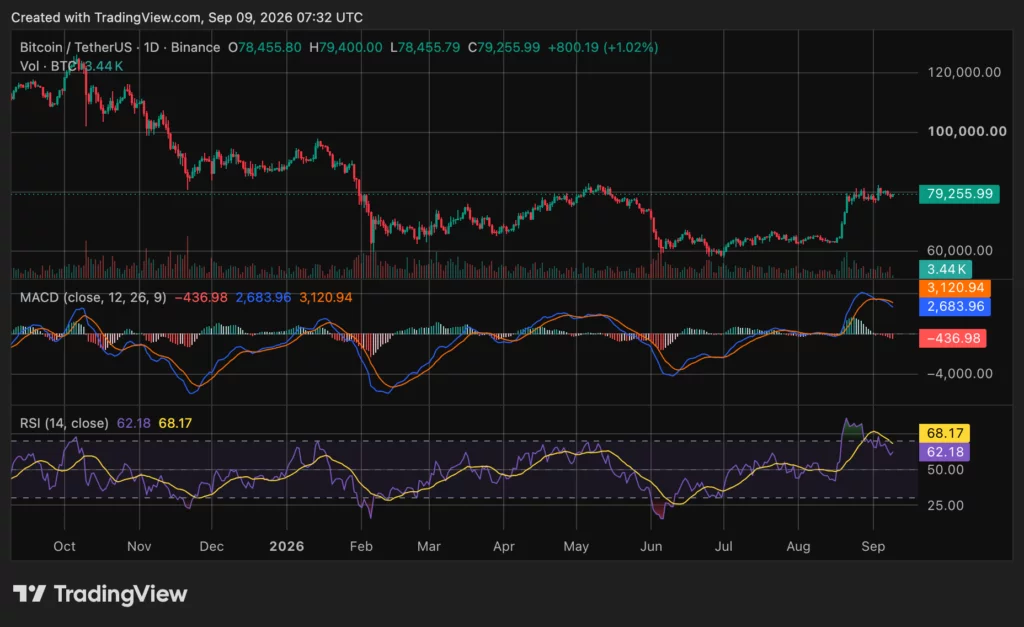
Trading volume also declined after the move toward $79,000. Lower volume during consolidation suggests fewer participants were pursuing the price after the sharp rebound.
These indicator values depend on the chart’s timeframe and update time. They should not be treated as permanent signals. A recovery in volume and a bullish MACD crossover would strengthen momentum, while a sustained move below nearby support could deepen the correction.
Wintermute identified $82,000 as the immediate level Bitcoin must clear and $72,000 as the level that would weaken its constructive view. Those are the firm’s trading reference points rather than guaranteed support or resistance.
Upcoming U.S. events will test the shallower-bottom theory
The next major inflation release and Federal Reserve meeting will test whether Bitcoin can remain resilient under tighter financial conditions.
The Federal Open Market Committee will meet on Sept. 15 and 16, according to the Fed’s official calendar. The policy statement is scheduled for 2 p.m. Eastern Time on Sept. 16, followed by a press conference.
The meeting will include updated economic projections. Traders will focus on the policy rate, inflation forecasts and officials’ expected path for future decisions.
A stronger inflation reading or a more restrictive Fed message could increase bond yields and pressure risk assets. Softer data could reduce rate expectations and support Bitcoin, although the market reaction will also depend on positioning before the announcements.
ETF flows offer another test. Continued inflows would support Wintermute’s argument that institutional capital is entering earlier during weakness. Sustained outflows would weaken that explanation, particularly if Bitcoin also falls below $72,000.
The available evidence supports a narrow conclusion. Bitcoin’s deepest loss this cycle has been much smaller than the 2018 and 2022 collapses. Its present drawdown is smaller still after the August recovery.
The evidence does not confirm that June was the final bottom or that future bear markets cannot become deeper. The current cycle has produced a shallower decline so far, but that pattern remains subject to macroeconomic conditions, ETF demand and Bitcoin’s response around $72,000 and $82,000.
FAQs
Is Bitcoin currently 50% below its record?
No. At approximately $79,200, Bitcoin is about 37% below its October 2025 record near $125,653. The 50% figure better describes the cycle’s earlier maximum drawdown.
Did Bitcoin bottom in June 2026?
June produced the lowest price of the current decline and a drawdown of approximately 52.6%. Wintermute said whether it marked the final bottom “is still open.”
Why could Bitcoin’s drawdowns be getting smaller?
Possible factors include spot ETF demand, broader institutional access and deeper liquidity. These explanations remain theories rather than proven causes.
What price levels is Wintermute watching?
Wintermute identified $82,000 as the upside level to clear and $72,000 as the level that would change its view.
What happens next for Bitcoin?
Markets face U.S. inflation data and the Sept. 15–16 Federal Reserve meeting. ETF flows and Bitcoin’s response around $72,000 and $82,000 will also be closely watched.