

Solana price rallied nearly 7% from its Aug. 7 low, breaking a five-week descending channel as proposed supply changes and institutional adoption renewed demand for SOL.
Summary
- Solana price rose from $72.49 to $77.36, breaking above a five-week descending channel.
- 4-hour Supertrend support flipped bullish at $75.02, strengthening the breakout structure.
- Liquidation clusters at $78 and $80 could accelerate gains if buyers maintain control.
- Daily momentum remains mixed, leaving $74–$75 as the main breakout invalidation zone.
Solana price breaks its five-week downtrend
According to data from crypto.news, Solana (SOL) price traded around $76.93 on Aug. 10, up nearly 7% from its Aug. 7 low of $72.49. The recovery pushed SOL through the upper boundary of a descending channel that had controlled its price since early July.
The 4-hour chart shows that SOL first reclaimed $74.30 before breaking the channel near $75. The price then climbed to an intraday high of $77.36, where buyers encountered initial resistance.
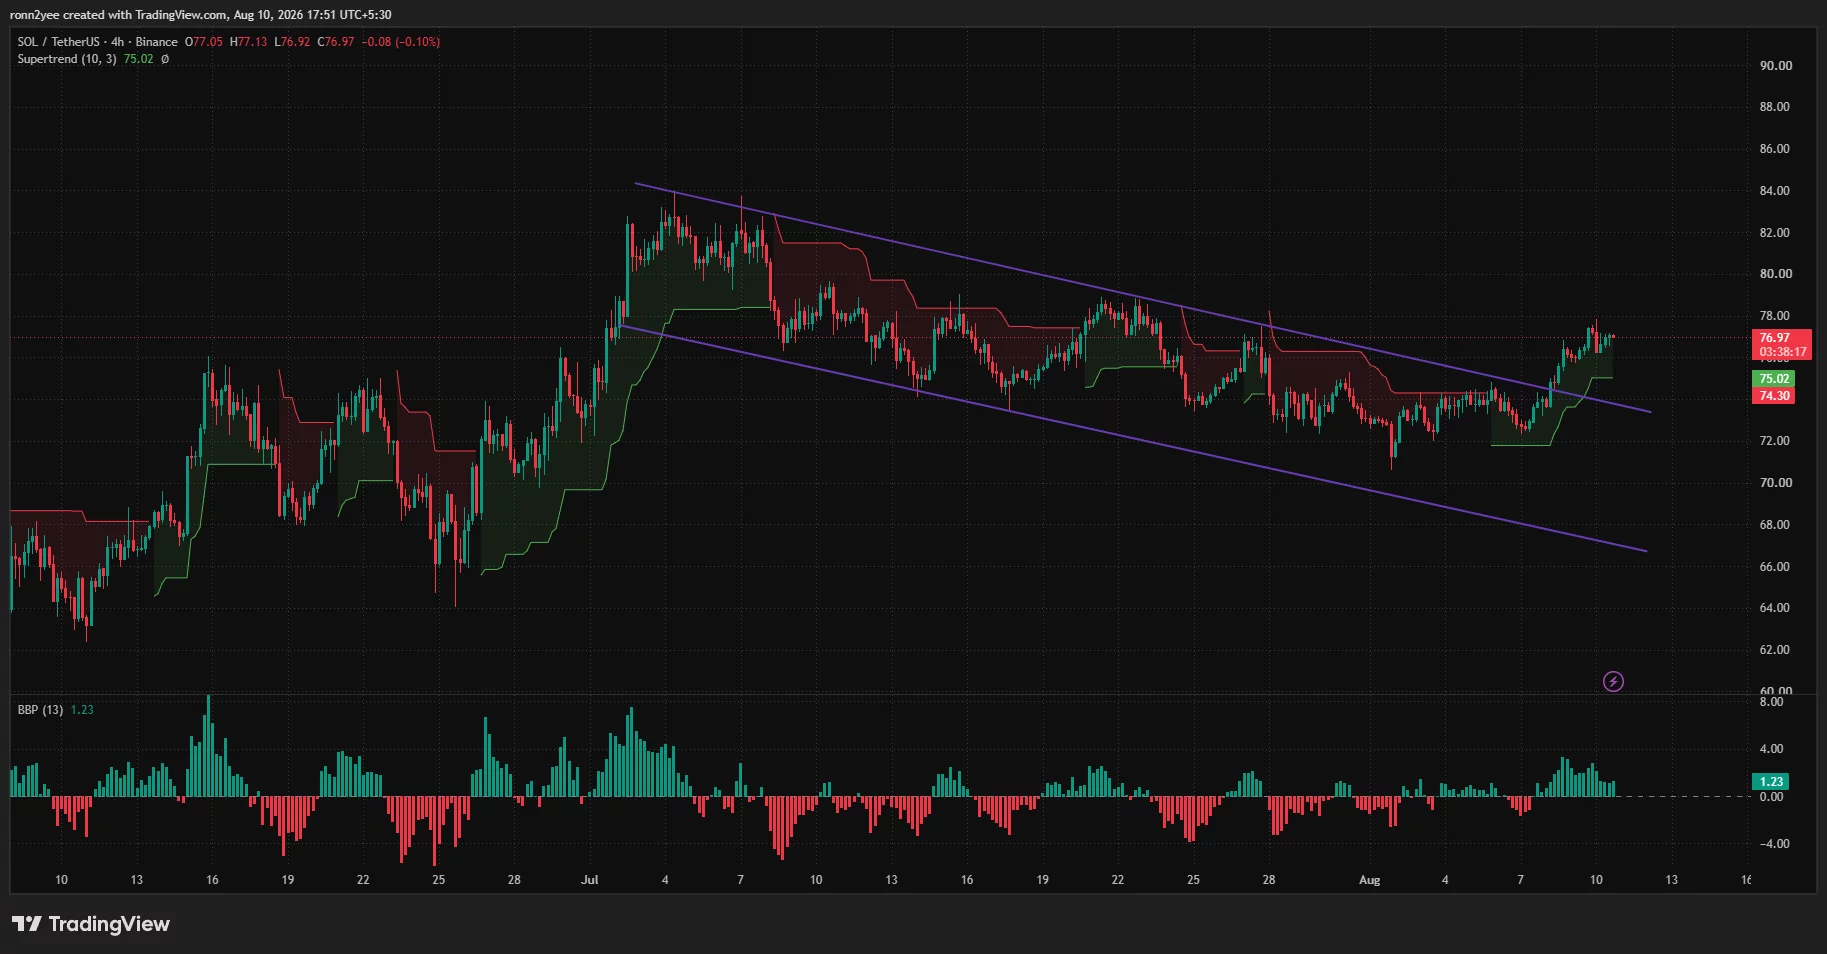
Trading volume expanded during the breakout, while the bull-bear power indicator rose to 1.23. A positive reading indicates that buyers currently have more short-term control than sellers.
The Supertrend indicator has also flipped below the market and now provides dynamic support at $75.02. Holding above this level would keep the 4-hour structure bullish and could turn the former channel resistance into support.
Crypto analyst Dami-Defi identified the same structural change in an Aug. 10 post on X.
“SOL just broke a five-week downtrend,” the analyst said.
The breakout does not yet confirm a broader trend reversal, however. SOL remains well below its May swing high near $97 and its January peak above $145.
What is driving the SOL recovery?
The rally coincided with growing validator support for two proposals designed to reduce Solana’s future supply growth.
SIMD-0550 would increase the annual disinflation rate from 15% to 30%, bringing the network toward its terminal inflation rate faster. SIMD-0553 would introduce resource-based transaction fees and could raise daily SOL burns from about 650 tokens to between 7,500 and 9,000.
The formal governance process is expected to run through Aug. 18. The proposals remain subject to validator approval, meaning their projected supply effects are not guaranteed. Solana’s governance forum describes SIMD-0550 as a doubling of the pace at which inflation declines.
Institutional developments have added another source of demand. BlackRock recently unveiled its Daily Reinvestment Stablecoin Reserve Vehicle, which can record fund ownership across several public blockchains, including Solana. The product holds cash, short-term U.S. Treasuries and repurchase agreements rather than SOL itself.
Western Union has also expanded its use of the network. Its USDPT stablecoin is issued on Solana by federally regulated Anchorage Digital Bank, while a related Stablecard product launched across 37 markets. Western Union formally launched USDPT on Solana in May.
These developments do not directly require institutions to purchase SOL in large amounts. They do, however, strengthen Solana’s case as infrastructure for regulated funds and dollar-based payments.
SOL targets $78 liquidity before $80
The three-day liquidation heatmap shows the nearest concentration of leveraged positions around $77.80–$78.20. This zone matches the next horizontal resistance visible on the 4-hour chart.
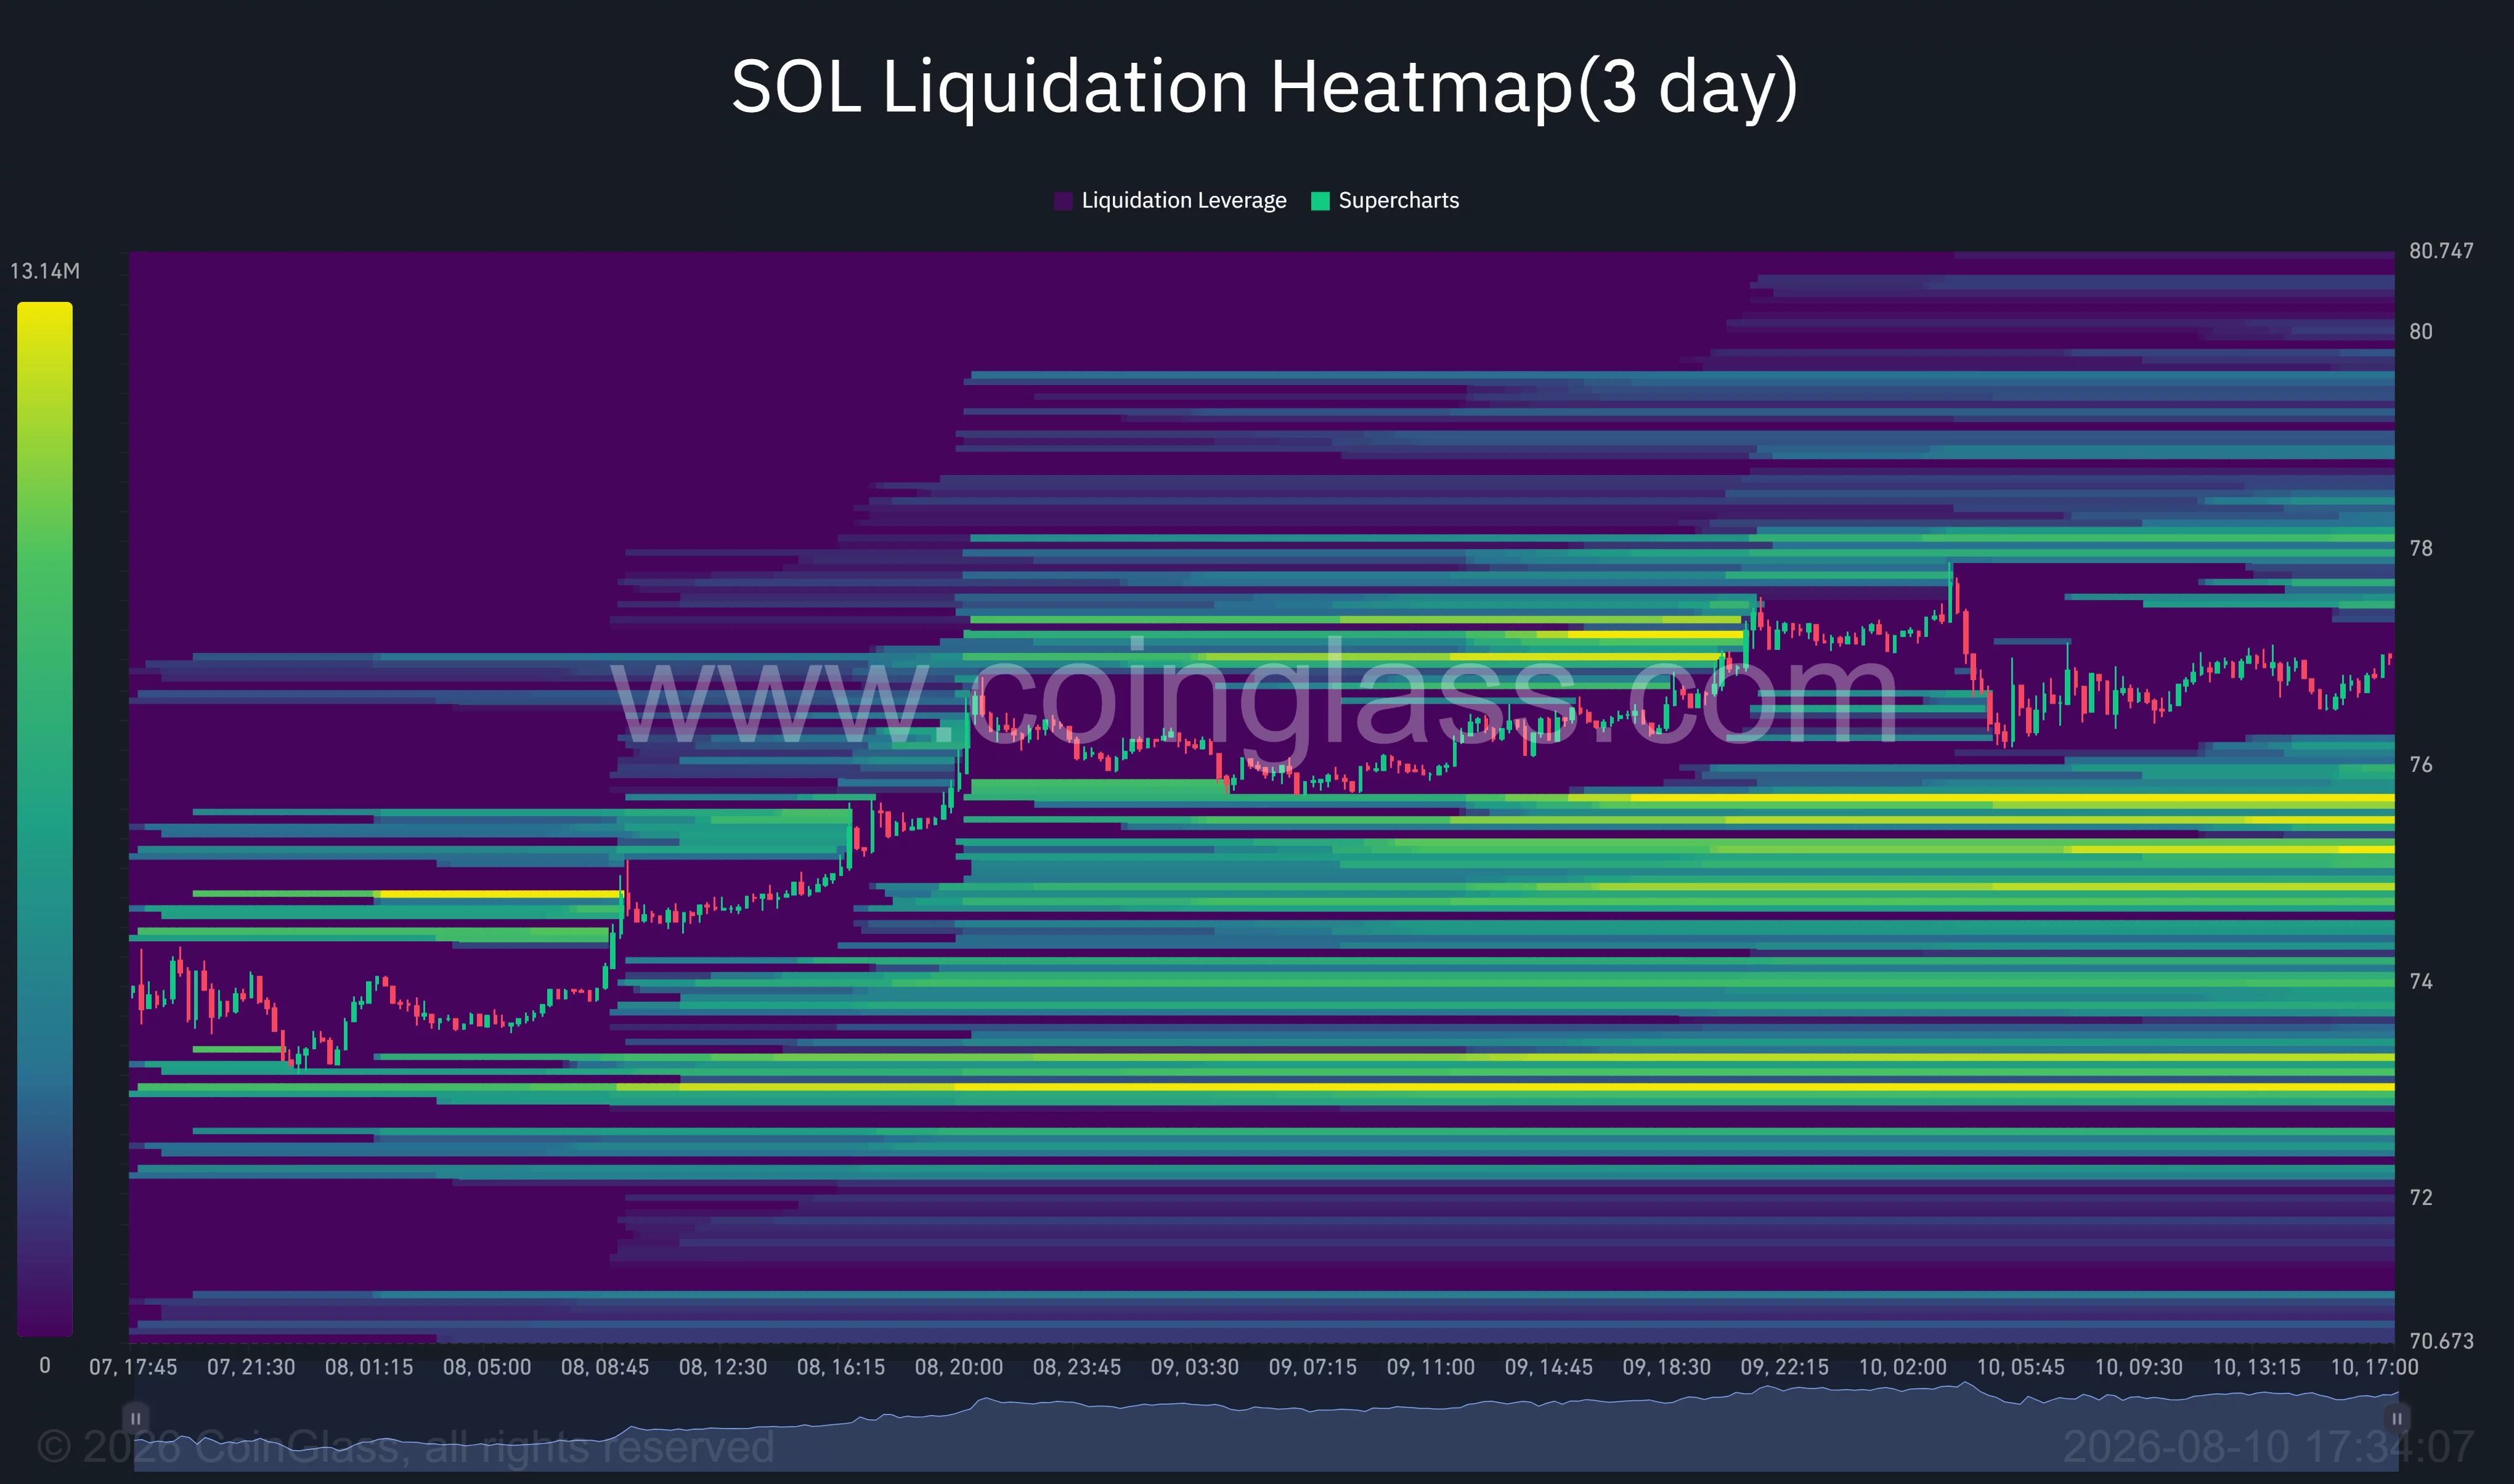
A break above $78 could trigger another round of short liquidations and open a move toward $80. The upper section of the former channel and previous July swing levels place the next larger resistance between $82 and $84.
Dami-Defi’s chart projects a possible move toward $83 if SOL successfully retests the broken trendline.
Michaël van de Poppe offered a more ambitious longer-term outlook. In an Aug. 10 market update, he said SOL had formed a higher low against Bitcoin and forecast a possible recovery toward $100–$120.
That target would require SOL to reclaim several resistance zones that are not visible in the current short-term breakout. The first tests remain $78, $80, and $83.
Daily Solana chart still needs confirmation
SOL’s daily chart is improving, although it has not produced a fully confirmed bullish reversal.
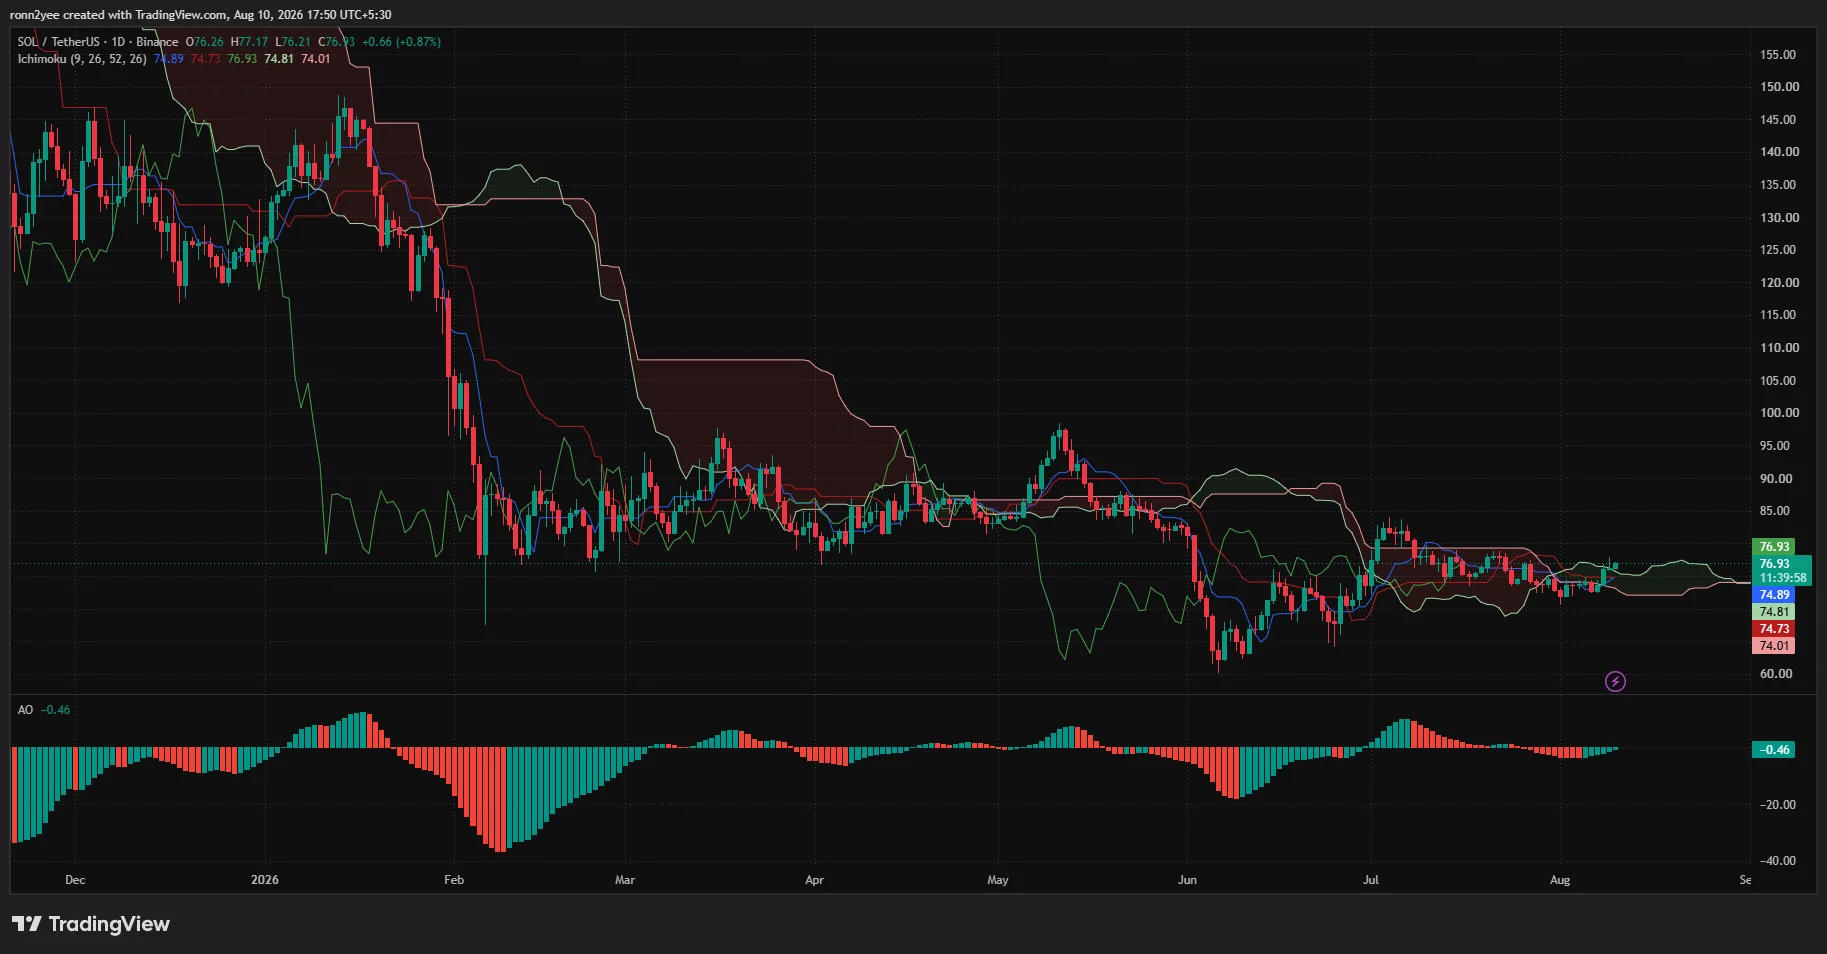
The price has moved above the Ichimoku conversion line at $74.89 and the baseline at $74.73. SOL is also attempting to clear the upper edge of the cloud around $76.93, making the current area an important daily closing level.
A sustained close above the cloud would strengthen the case for a move toward $80–$84. Rejection near $77, however, could send SOL back to test the Ichimoku cluster between $74.73 and $74.89.
The Awesome Oscillator remains slightly negative at -0.46. Its red bars have contracted and the indicator is moving toward zero, suggesting bearish momentum is fading but has not yet reversed completely.
Liquidation data reinforces the downside levels. Large long-liquidation concentrations sit around $75.70, $75.10 and $72.80. If SOL loses $75, forced selling could pull the price toward $73 before buyers regain control.
US developments remain a key SOL catalyst
Solana’s institutional adoption has become increasingly tied to regulated U.S. financial infrastructure. BlackRock’s fund structure involves tokenized ownership of Treasury-backed assets, while Western Union’s USDPT is issued by a U.S. federally chartered crypto bank.
The next network catalyst is the planned Alpenglow rollout. The upgrade aims to reduce transaction finality from about 12.8 seconds to between 100 and 150 milliseconds, with implementation expected in stages between August and October if testing proceeds as planned.
For now, SOL’s 4-hour breakout favors buyers while the price remains above $75. A daily close above $78 would provide stronger confirmation and shift focus toward $80–$84. Losing $74 would place the breakout at risk and reopen the path toward $72.80.
Disclosure: This article does not represent investment advice. The content and materials featured on this page are for educational purposes only.