


Solana price has climbed to $78 after buyers defended support near $74, though repeated failures below $80 and lingering concern over the BONK governance attack have kept market sentiment cautious.
Summary
- Solana price has recovered to $78 but must close above $80 to confirm a breakout.
- SOL trades above four key moving averages, while liquidity clusters could trigger a short squeeze.
- A loss of the $75.55 support would expose $72.50 and the June range floor near $67.
According to data from crypto.news, Solana (SOL) price traded at $78.03 at press time, up marginally over the past 24 hours after moving between an intraday low of $77.42 and a high of $78.88. The token has recovered about 5% from its July 18 low but remains below the $82–$84 zone reached earlier this month.
Confidence across the Solana ecosystem took a hit after an attacker drained nearly $20 million from the BonkDAO treasury. According to crypto.news, the attacker spent roughly $4.4 million to acquire enough BONK to meet the governance threshold, then passed a proposal with 99.9% approval.
The incident did not compromise Solana’s base layer, but it exposed weak safeguards within a major ecosystem project. BonkDAO had low voter participation, no execution delay, and enough concentrated voting power for one participant to control the result, according to crypto.news analysis.
Meanwhile, demand through regulated investment products has provided some support. U.S. spot Solana exchange-traded funds recorded $8.36 million in net inflows on July 6, their strongest day in nearly two months, according to data from SoSoValue. Early-July inflows reached about $5.75 million during one full trading week, with no daily outflow reported over the period.
Geopolitical pressure remains a hurdle for high-beta cryptocurrencies. Brent crude settled at $91.01 on July 21 after U.S.-Iran hostilities, and Houthi threats against Red Sea shipping routes raised concern over energy supplies. The dollar index also advanced to 101.16 as traders increased bets that higher oil costs could keep the Federal Reserve focused on inflation, Reuters reported.
A stronger dollar and renewed rate-hike expectations usually reduce demand for speculative assets. Solana may therefore need both crypto-market strength and less pressure from energy prices to sustain a move beyond nearby resistance.
Solana needs a daily close above $80 to unlock the next range
The daily chart places SOL directly below resistance at $78.92, a level that previously acted as support in February, April and early June. Buyers briefly reclaimed it during the first half of July, but price slipped back underneath after stalling near $83.
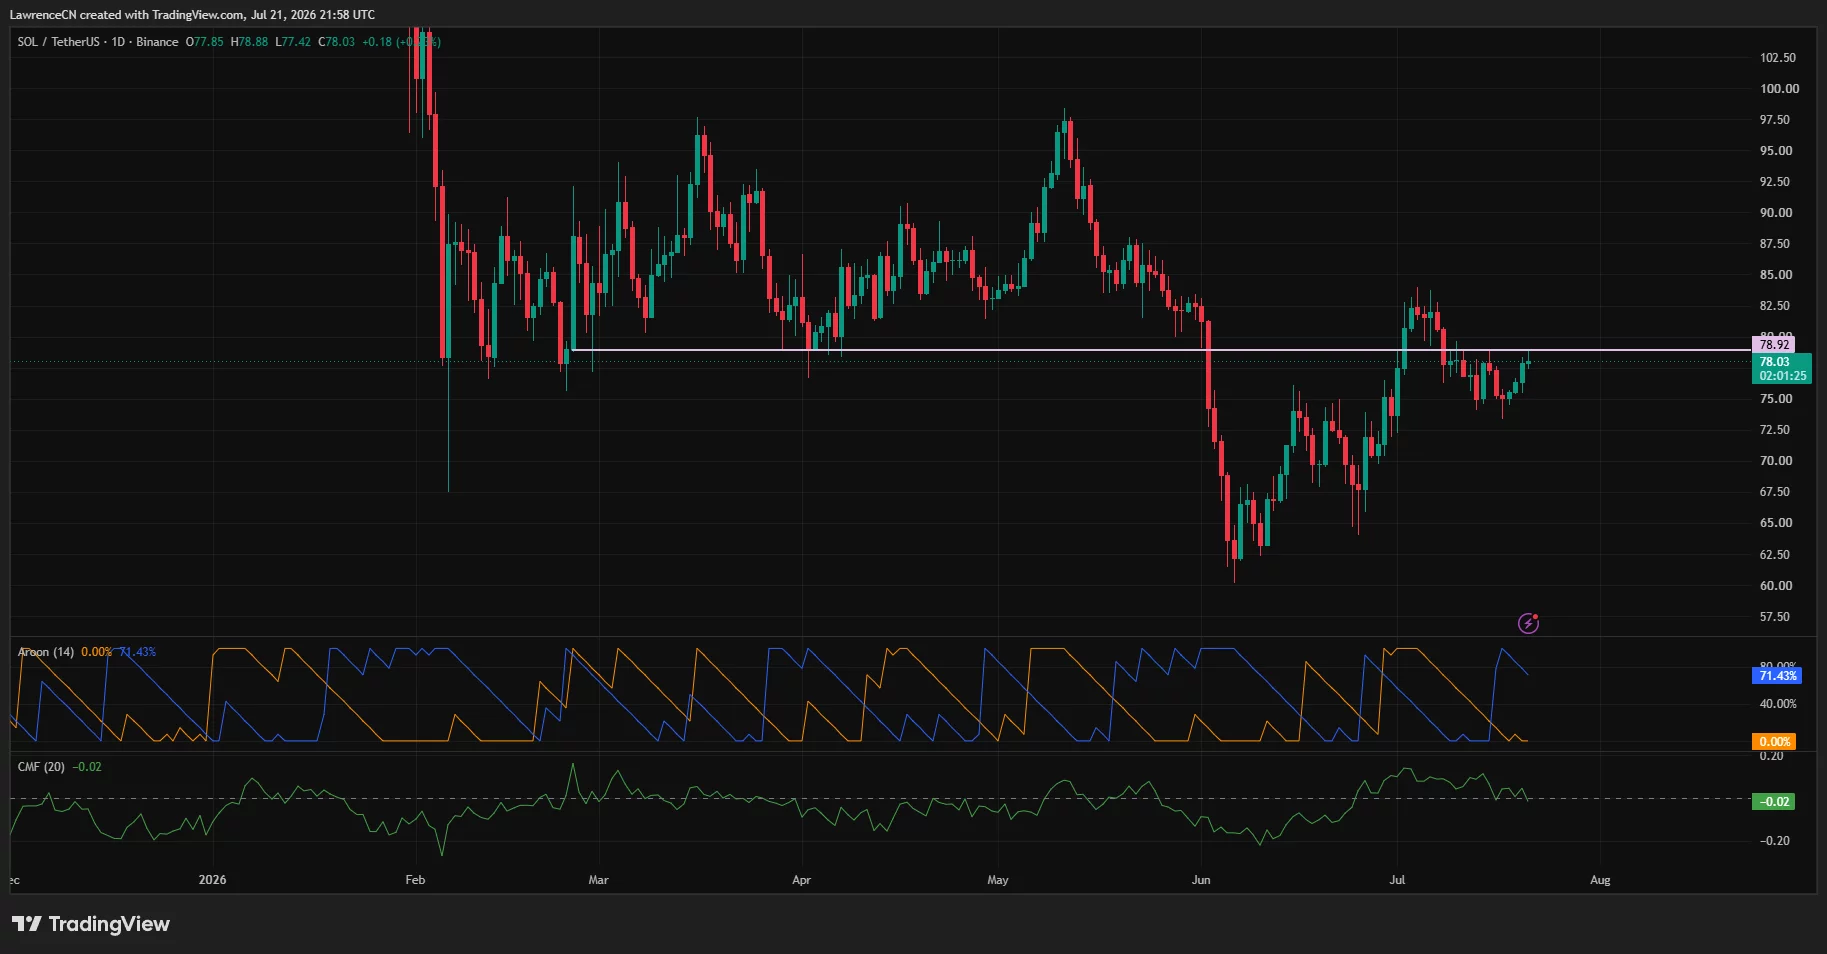
A daily close above $78.92 would clear the first barrier, while $80 remains the psychological level required to confirm a breakout. Beyond it, the July swing highs between $82.50 and $84 form the next supply zone. A close above $84 could open the route toward $90 and the previous range high near $97.60.
Daily momentum favors another test. The Aroon Up reading stands at 71.43%, while Aroon Down has fallen to zero, showing that recent highs carry more weight than recent lows. However, the Chaikin Money Flow remains slightly negative at -0.02, which shows that capital inflows have not yet matched the price recovery.
According to crypto trader Daan Crypto Trades, SOL has reached a “key high timeframe region” that will decide whether bulls can attack the upper end of the range.
“Either the bulls push through and set a higher low here to take a stab at the range high in the $90s. Or this rejects here and dribbles back down to that mid $60s area.”
The 4-hour chart offers a more constructive setup. SOL trades above its 20-period moving average at $77.01, its 50-period average at $76.42, its 100-period average at $77.60 and its 200-period average at $75.55. Regaining all four lines has placed short-term control with buyers.
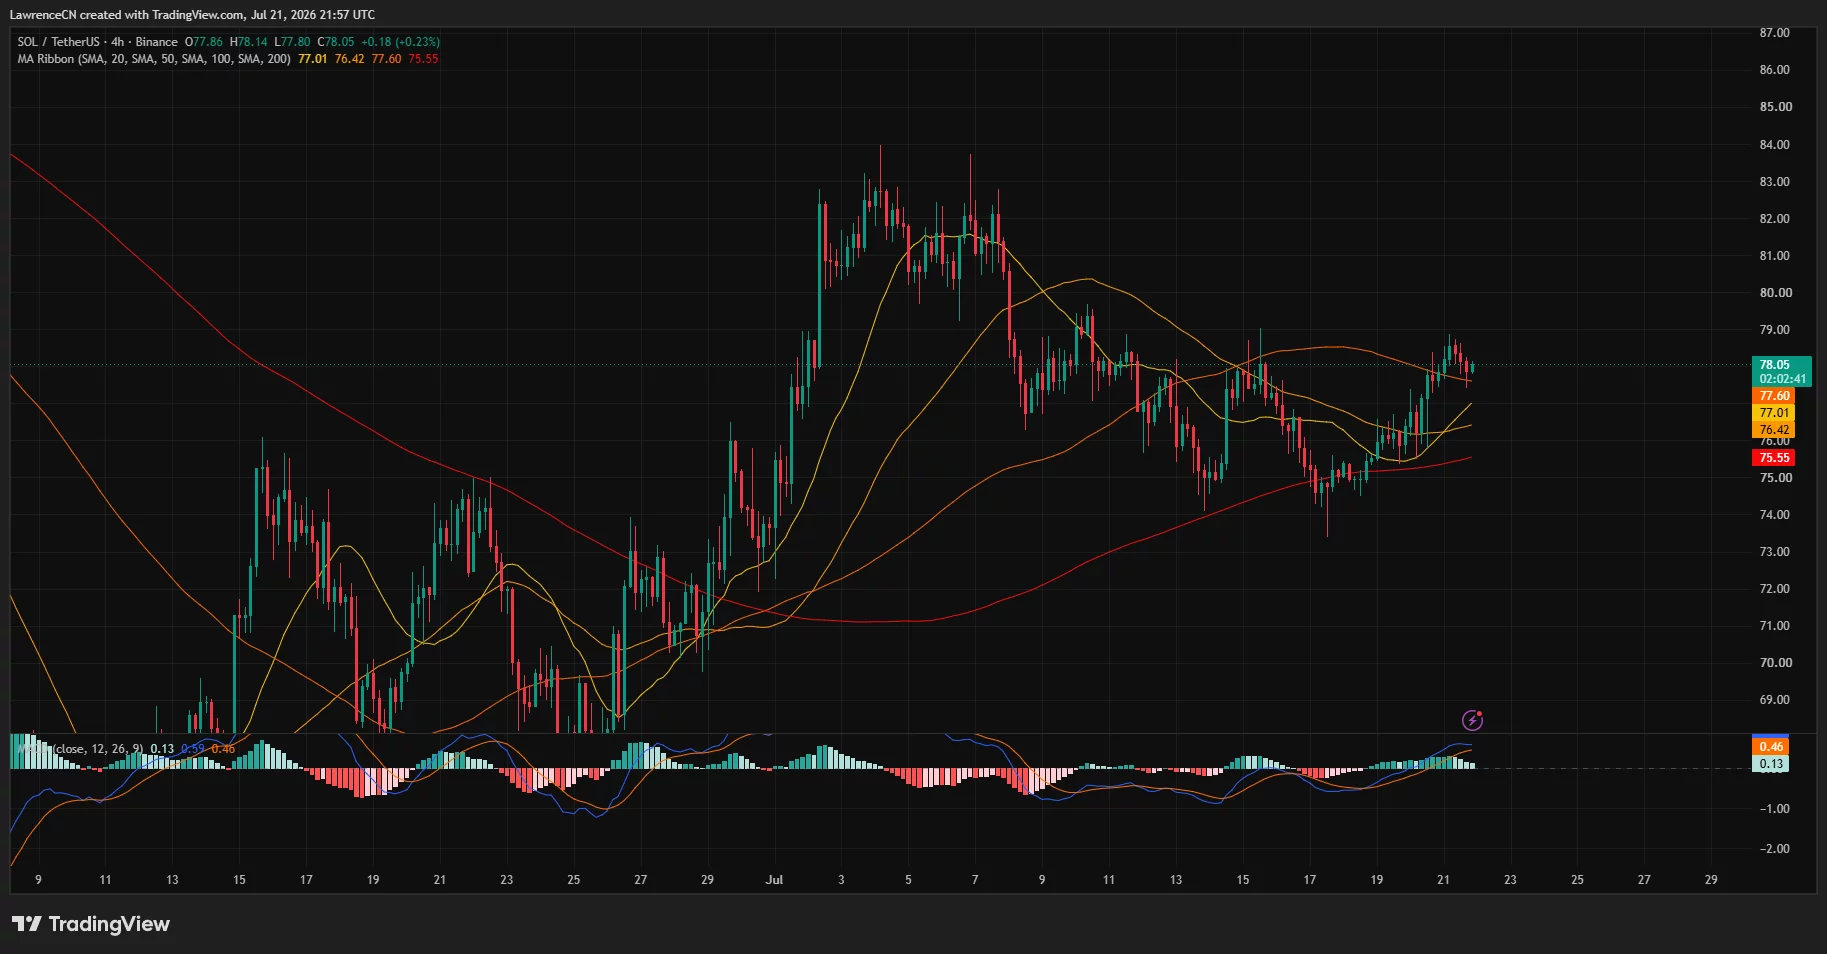
The 4-hour MACD remains above its signal line, although its histogram has narrowed to 0.13. Momentum has therefore stayed positive, but buyers need stronger follow-through before the move can extend through $80.
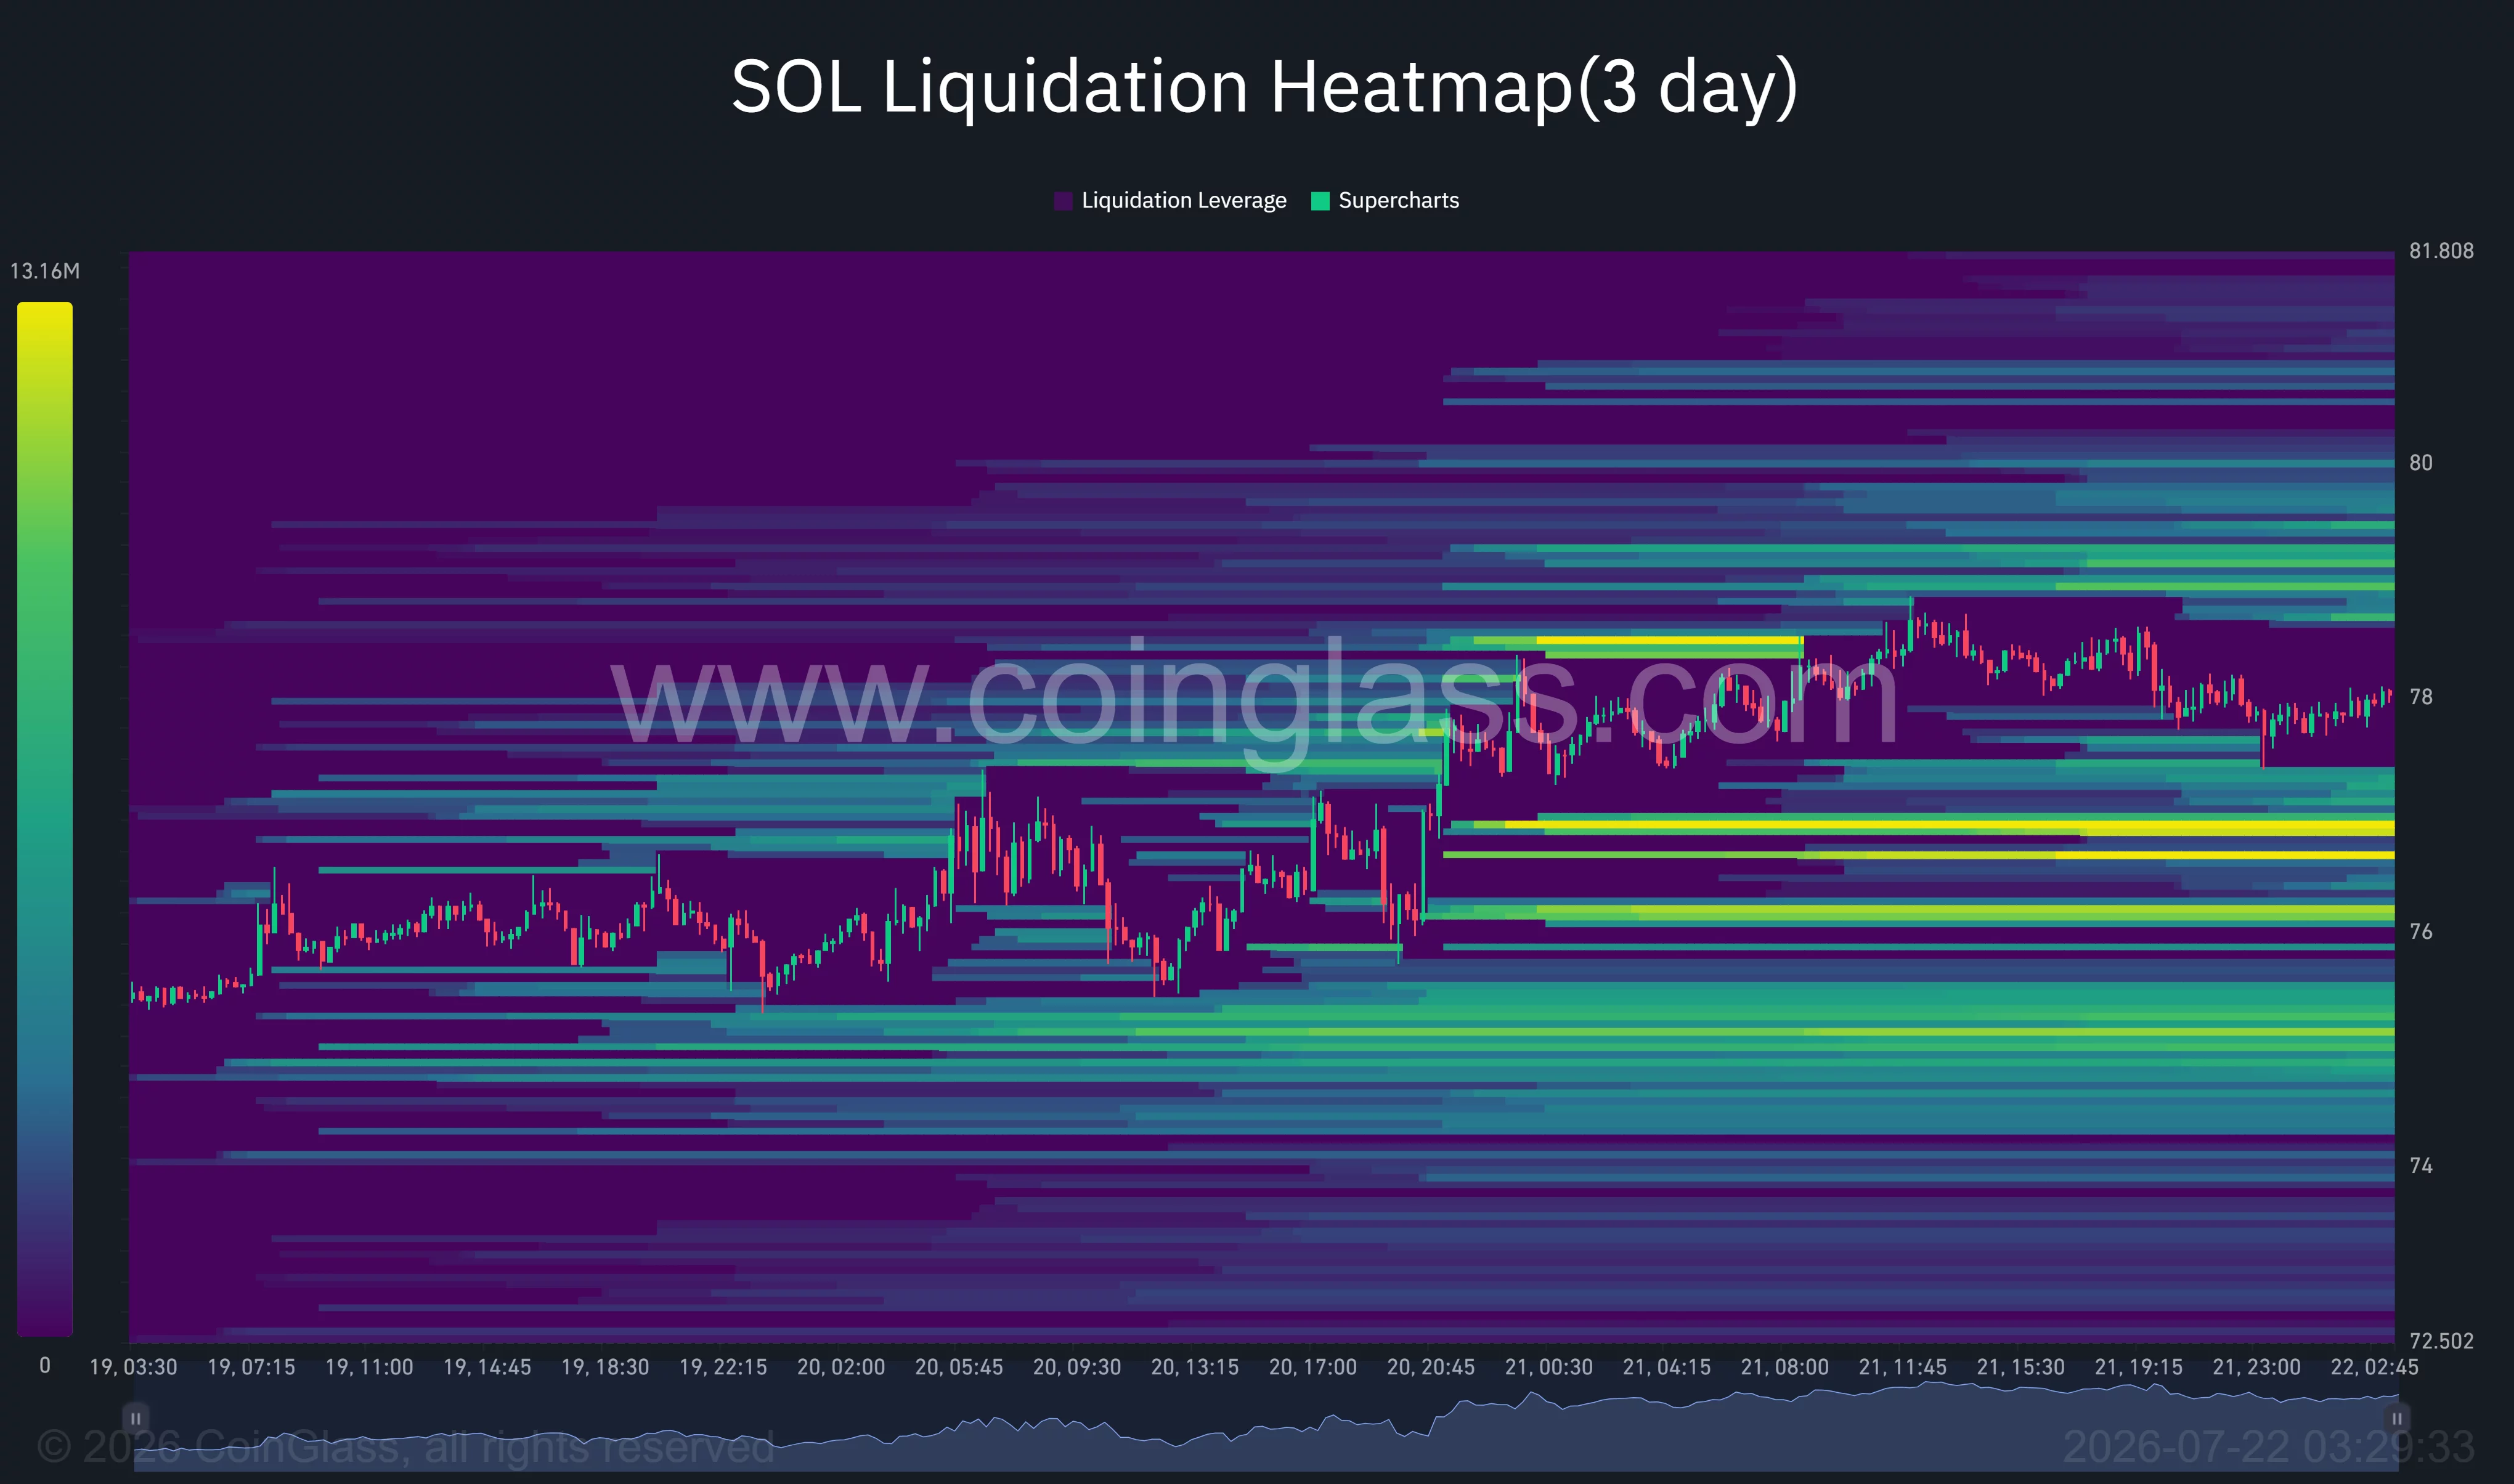
Derivatives liquidity could help accelerate a breakout. CoinGlass’ three-day liquidation heatmap shows concentrated short-liquidation bands near $78.50, $79.20 and $80.60. A move through $79 could force leveraged bears to close positions and add market buy orders, creating the conditions for a quick test of $81.
Loss of $75.50 would invalidate the bullish setup
Below the market, the largest nearby liquidation pools sit around $76.80, $76.10 and $75. A downturn through those levels could trigger long liquidations and pull SOL toward $74, where buyers stepped in during the latest retracement.
The 4-hour 200-period moving average at $75.55 serves as the main invalidation line. A sustained close below it would return SOL beneath its moving-average cluster and expose $72.50, followed by the June range floor near $67.
Oil above $90, further U.S.-Iran escalation, or another Solana ecosystem security incident could strengthen the bearish case. For now, the charts support another attempt at $80, but SOL must close above that level with stronger capital inflows to turn the recovery into a confirmed breakout.
Disclosure: This article does not represent investment advice. The content and materials featured on this page are for educational purposes only.