


Cardano price has fallen more than 11% against its weekly opening level, leaving ADA near $0.223 as market commentator Nehal outlines a conditional recovery toward $0.30–$0.36 from support around $0.21–$0.22.
Summary
- Cardano traded near $0.223, with its weekly chart showing an 11.57% decline.
- Daily RSI stood at 42.07, while ADA remained below its $0.2441 moving average.
- Nehal outlined conditional targets of $0.30–$0.36, with invalidation below $0.21.
- CoinGlass showed overhead liquidation concentrations around $0.234–$0.235 and $0.240–$0.244.
TradingView’s Binance ADA/USDT weekly chart showed ADA at $0.2231 on Oct. 17, with a displayed decline of 11.57%. The weekly range ran from $0.2159 to $0.2561, while the daily chart placed the token at $0.2232 at 11:40 UTC.
Cardano price retreats toward the lower Bollinger Band
On the daily chart, TradingView recorded a session high of $0.2258 and a low of $0.2226. ADA was down 1.11% from the daily opening price of $0.2257, leaving it close to the bottom of that session’s range.
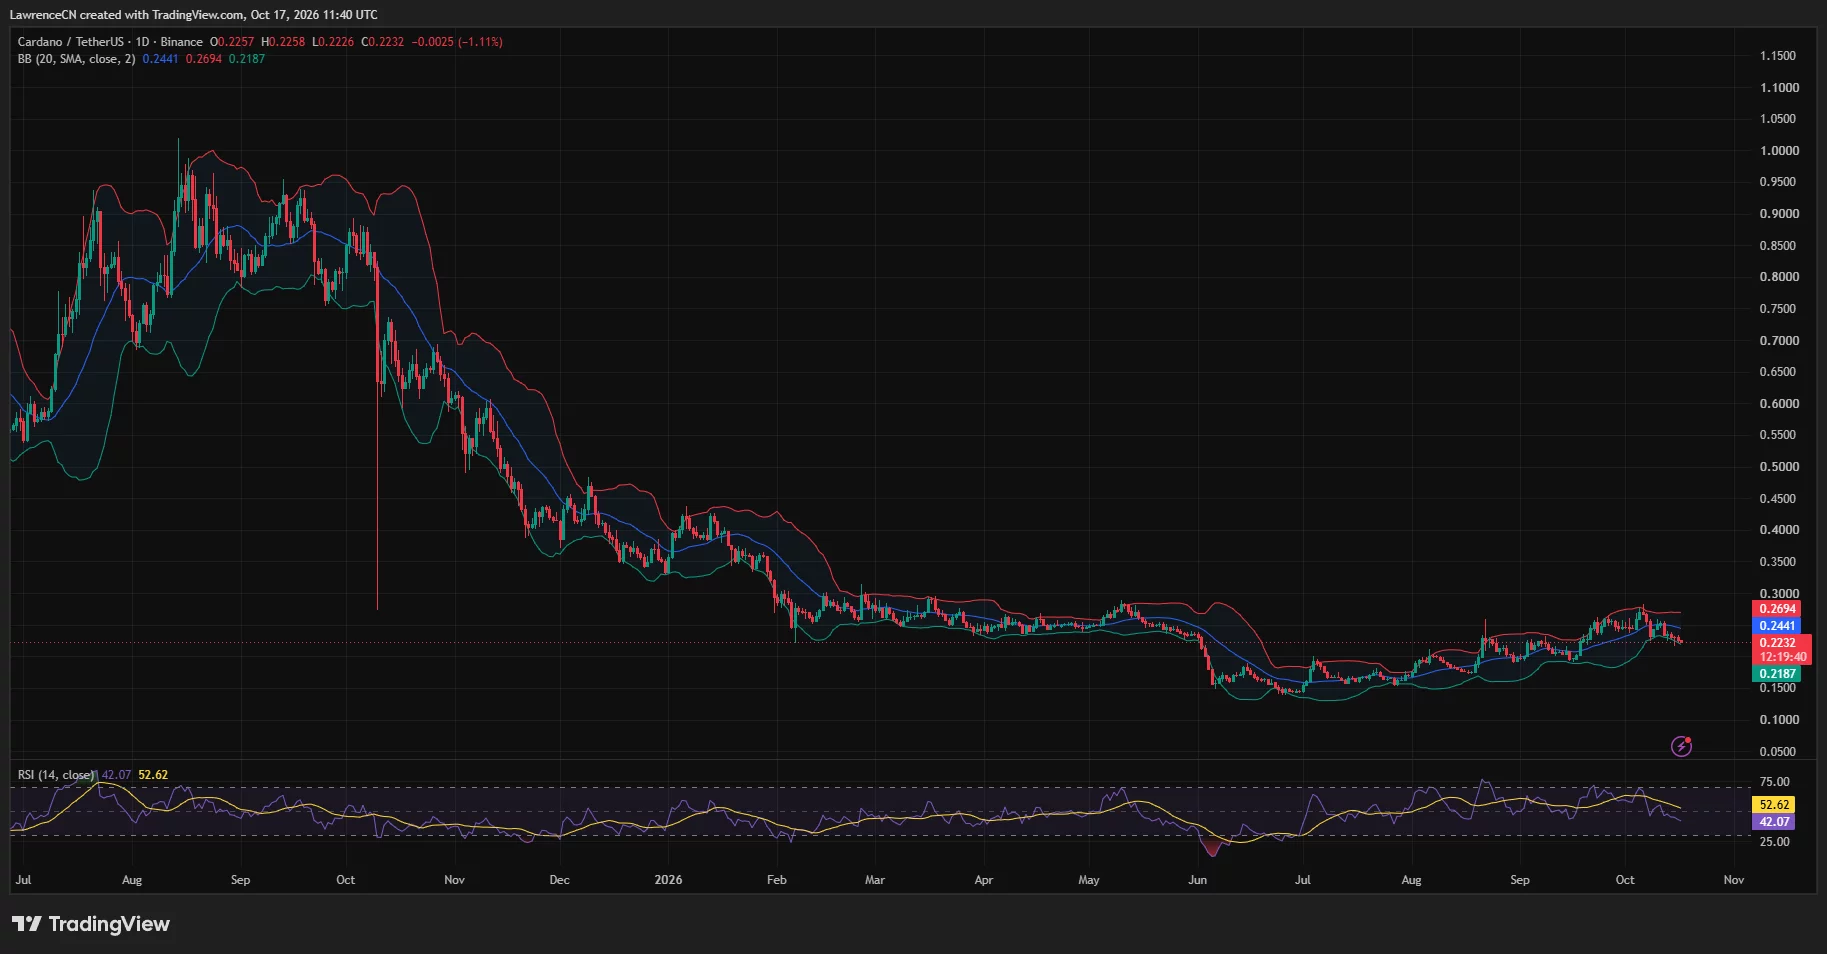
The Bollinger Bands placed the 20-day simple moving average at $0.2441, the upper band at $0.2694, and the lower band at $0.2187. ADA traded below the average and just above the lower boundary.
Measured from the daily chart price of $0.2232, a return to the middle band would require a gain of 9.4%. The lower band sat approximately 2% beneath that price, while the recorded weekly low was roughly 3.3% lower.
TradingView’s daily relative strength index stood at 42.07, below the neutral 50 threshold. Its displayed average measured 52.62, placing the RSI beneath both reference points without reaching the conventional oversold threshold of 30.
The latest decline follows the loss of an earlier support area. As crypto.news previously reported on Oct. 12, analyst Jesse Olson had identified bearish divergence and a potential lower high while ADA traded near $0.2434.
That coverage placed the previous support zone at $0.224–$0.240, based on a separate assessment by analyst Giannis Andreou. Compared with the Oct. 12 chart reading, the latest daily price was 8.3% lower and beneath that zone’s lower edge.
Nehal’s $0.36 scenario requires a daily breakout
In an Oct. 16 post, Nehal described ADA as sitting on support between $0.21 and $0.22 while testing a long-term descending trendline. His accompanying Coinbase daily chart illustrated an upward path from that area.
“A clean daily breakout could send ADA toward $0.30 → $0.36.”
The market commentator attached a clear condition to that forecast.
“Bullish above the trendline; invalidation below $0.21.”
Using the Binance daily reading of $0.2232 as the reference, the two targets would require gains of approximately 34.4% and 61.3%. Those calculations use a different venue and timestamp from the Coinbase chart in Nehal’s post.
His invalidation level lies 5.9% below the Binance reading. The forecast therefore depends on a breakout and continued support above $0.21, rather than treating the current price as confirmation that a recovery has begun.
An Oct. 14 assessment by Andreou used a separate set of conditions. His conditional recovery setup required ADA to hold $0.22–$0.24 and regain $0.26–$0.28 before approaching a breakout test at $0.2910.
According to that assessment, a confirmed break and retest of $0.2910 would bring $0.3206 and $0.3698 into focus. On the downside, Andreou identified $0.2110 and $0.19–$0.20 as possible levels following a loss of $0.22.
The Oct. 14 Binance daily chart recorded ADA at $0.2278. The latest $0.2232 reading was approximately 2% below that earlier observation, although both remained above Andreou’s $0.22 threshold at their respective timestamps.
Weekly MACD remains above its signal line
Despite the weekly price decline, TradingView’s weekly MACD line stood at −0.0111, above its signal line at −0.0257. The histogram remained positive at 0.0145.
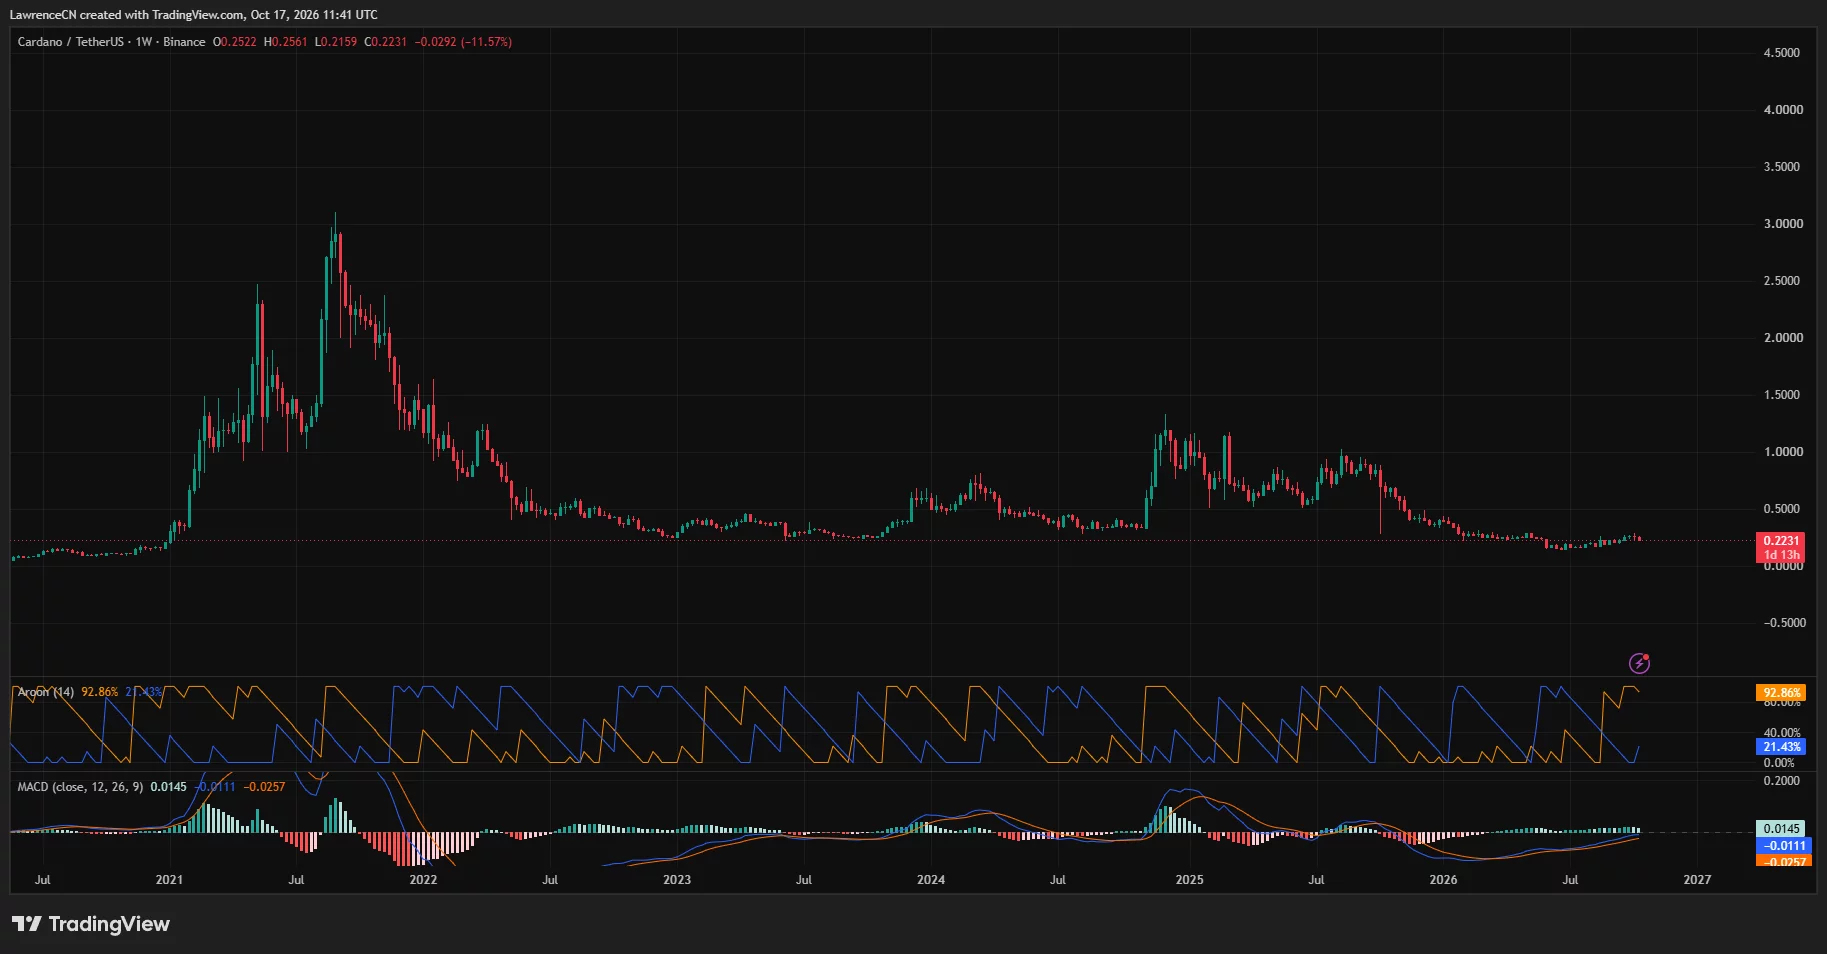
The weekly readings show the MACD line above its signal while both remain below zero. On the daily timeframe, the RSI remained below 50, giving the two charts different momentum readings.
The weekly price chart recorded a rebound from its $0.2159 low to approximately $0.2231. Calculated from those displayed values, the recovery amounted to 3.3%, leaving ADA below the week’s opening level.
CoinGlass’s one-week liquidation heatmap showed estimated liquidation concentrations around $0.234–$0.235 and $0.240–$0.244 above the market. A higher concentration appeared near $0.259–$0.260, with lower bands around $0.220 and $0.215–$0.217.
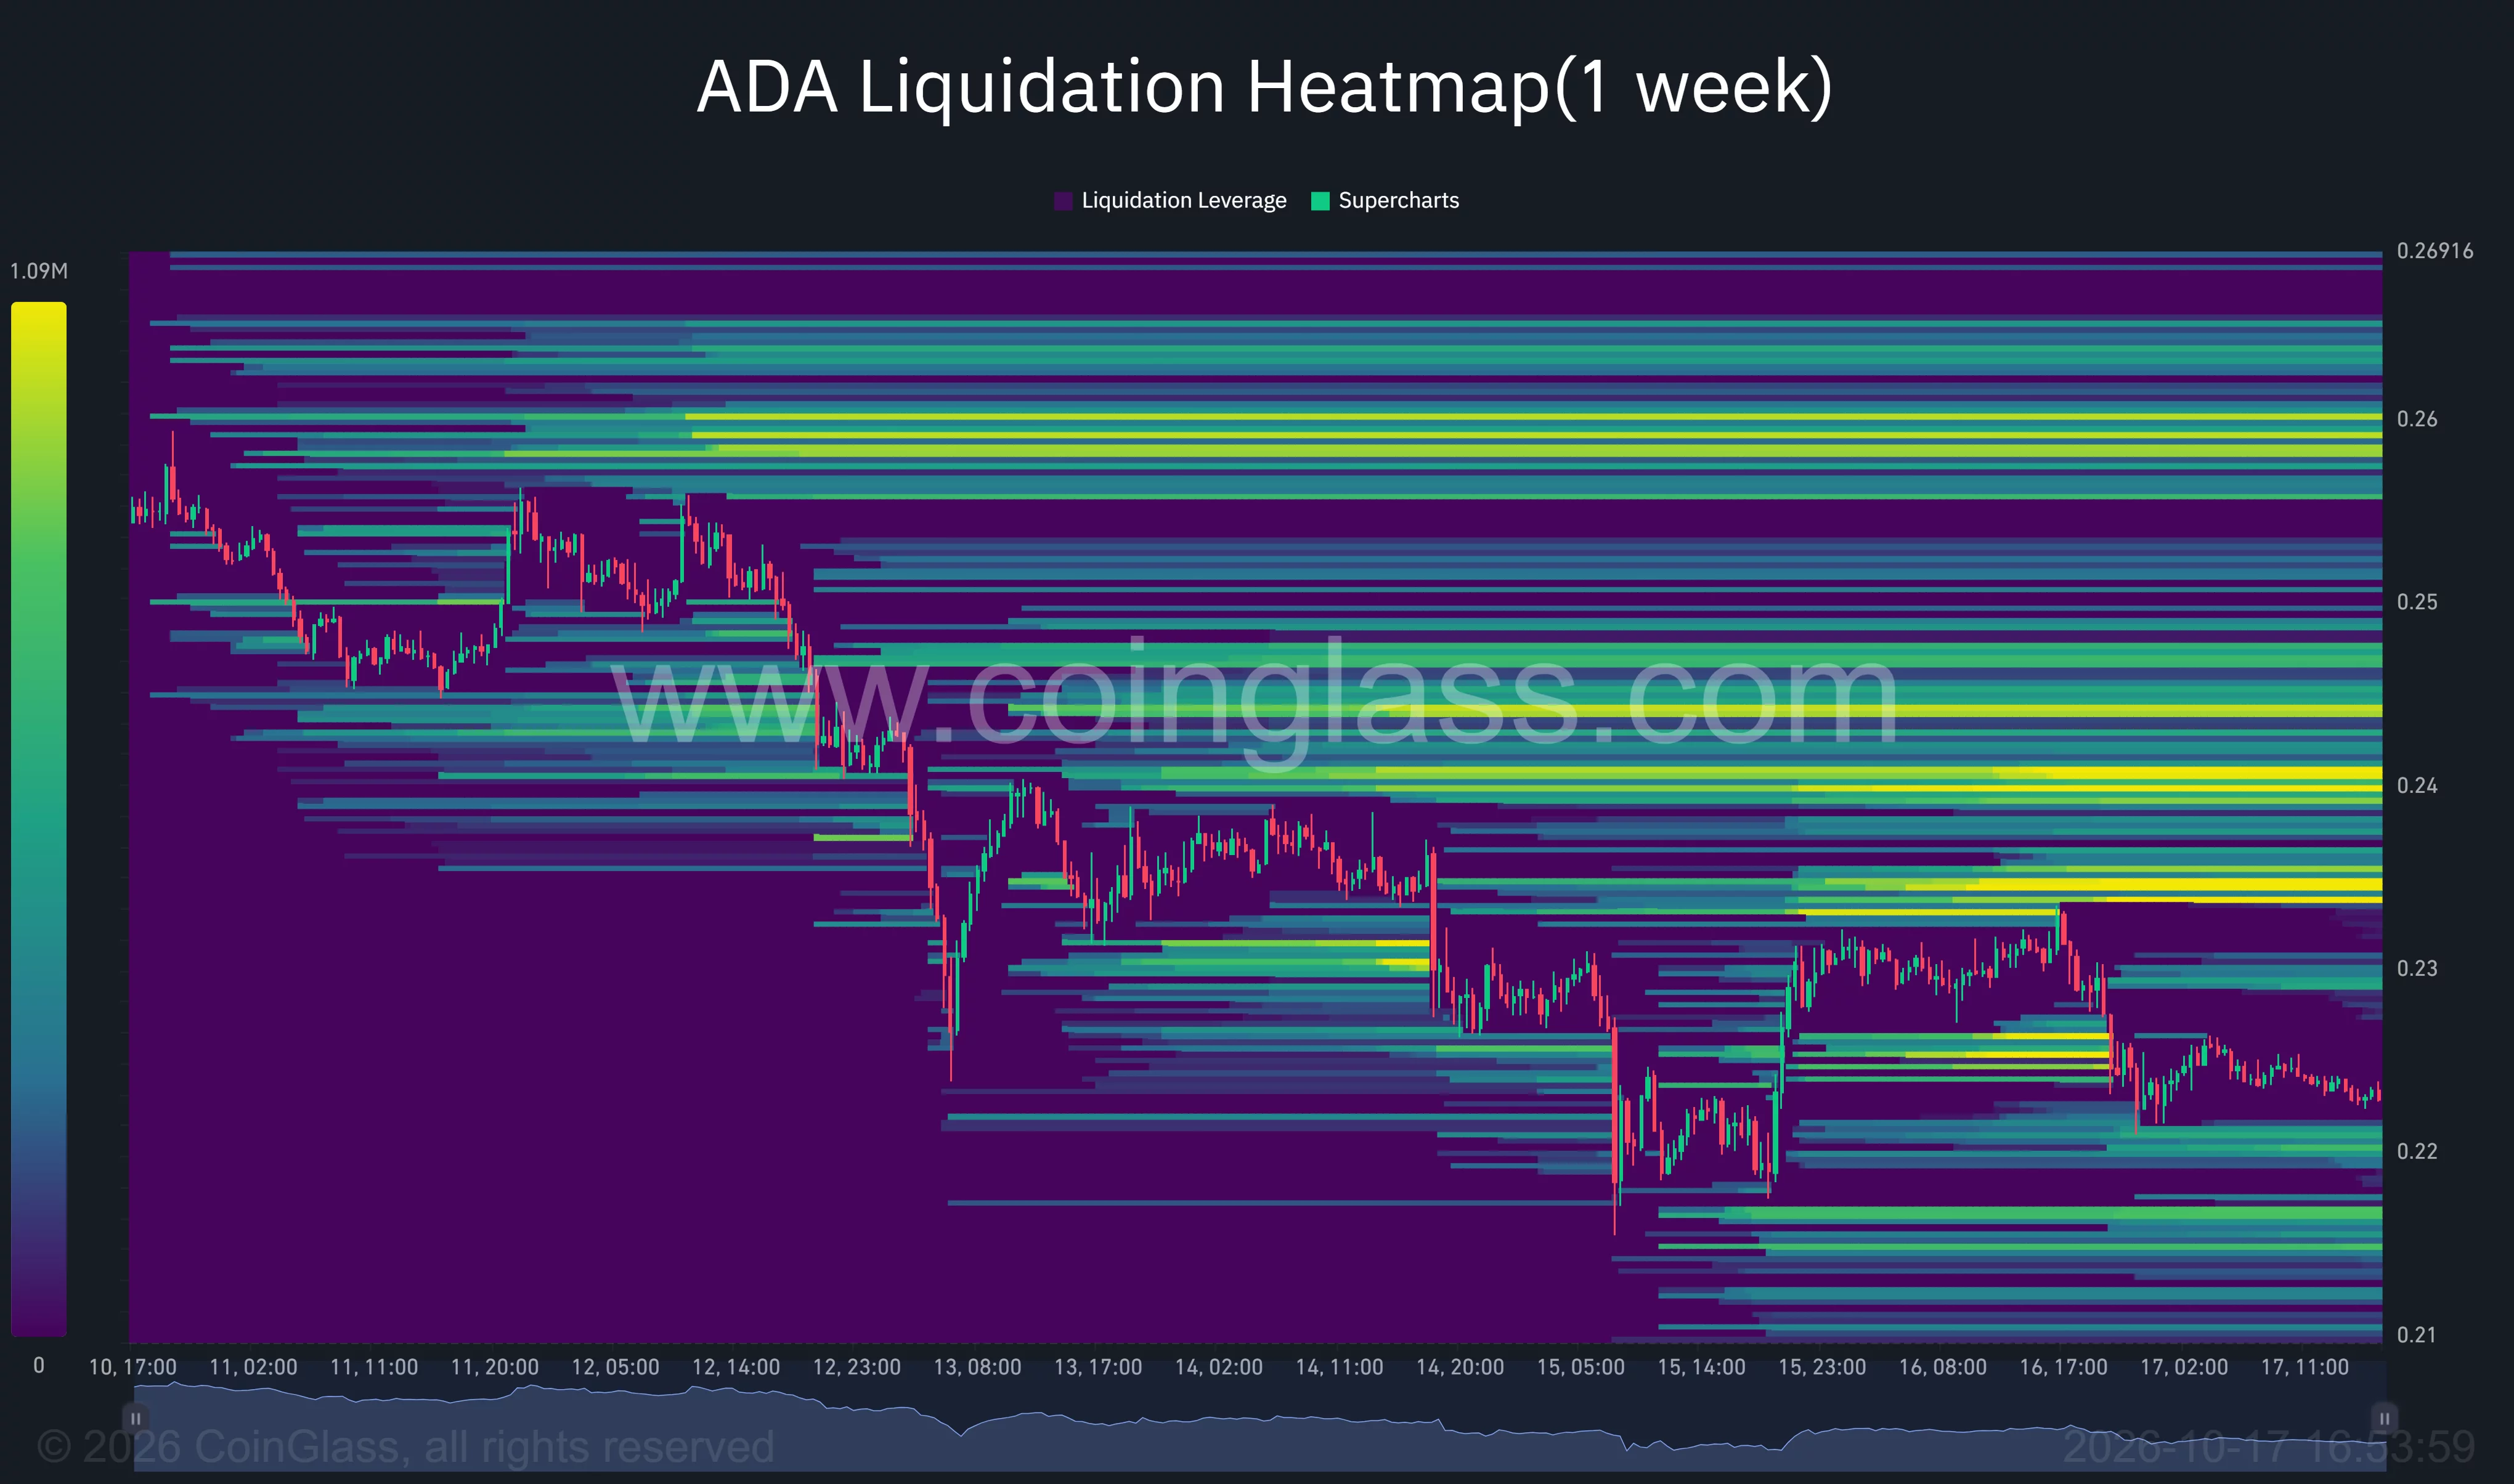
Those heatmap values represent estimated liquidation exposure at different prices, not completed forced closures. The image does not provide a total for realized ADA liquidations during the week.
Earlier network figures show different activity trends
In separate large-holder activity figures published Oct. 13, analyst Ali Martinez cited Santiment data showing a reduction of more than 110 million ADA in large holders’ combined balances over five days.
The same coverage recorded daily active addresses falling from 27,248 to 15,977, a decline of 41.36%. Those observations describe the earlier reporting period, rather than a fresh measurement of activity on Oct. 17.
Cexplorer’s figures cited in that report showed Cardano processing 1,780,896 transactions during Epoch 660, spanning Oct. 6–11. The previous record was 1,566,974 transactions in Epoch 304 in November 2021. The platform recorded average activity of 83.83 transactions per block and fees totaling approximately 337,720 ADA during Epoch 660.
Separately, DRepTalk’s treasury tracker listed 457,395,629 ADA consumed against a 500 million ADA withdrawal limit covering epochs 613–713. The remaining allowance was 42,604,371 ADA, or approximately 8.5% of the ceiling.
The tracker specifies that the limit caps treasury outflows, not the total treasury balance. Its withdrawal table included 120 million ADA for AlphaGrowth’s Cardano PRIME and 50 million ADA for the Cardano x Draper Dragon Orion Fund.
Disclosure: This article does not represent investment advice. The content and materials featured on this page are for educational purposes only.