


Ethereum has remained below $1,800 as traders await U.S. inflation data despite growing expectations of a breakout above $1,850.
Summary
- Ethereum remains below $1,800 as traders await U.S. CPI data and Fed signals.
- A breakout above $1,850 could trigger short liquidations and open a path toward $2,200.
- Analysts continue to back the bullish setup while $1,750 remains Ethereum’s key support.
The second-largest cryptocurrency traded around $1,780 after briefly slipping toward $1,770 following the latest geopolitical flare-up in the Middle East. Oil prices jumped after the weekend strikes, reviving concerns that inflation could remain elevated ahead of the June CPI release and Paul Warsh’s expected congressional testimony.
Any upside surprise could reinforce expectations for a hawkish Federal Reserve, limiting demand for risk assets and making the $1,800 barrier harder to overcome.
Derivatives positioning, however, presents a more balanced picture than price action alone. CoinGlass liquidation data shows one of the largest short liquidation clusters sitting between roughly $1,800 and $1,850, while additional liquidity rests closer to $1,900.
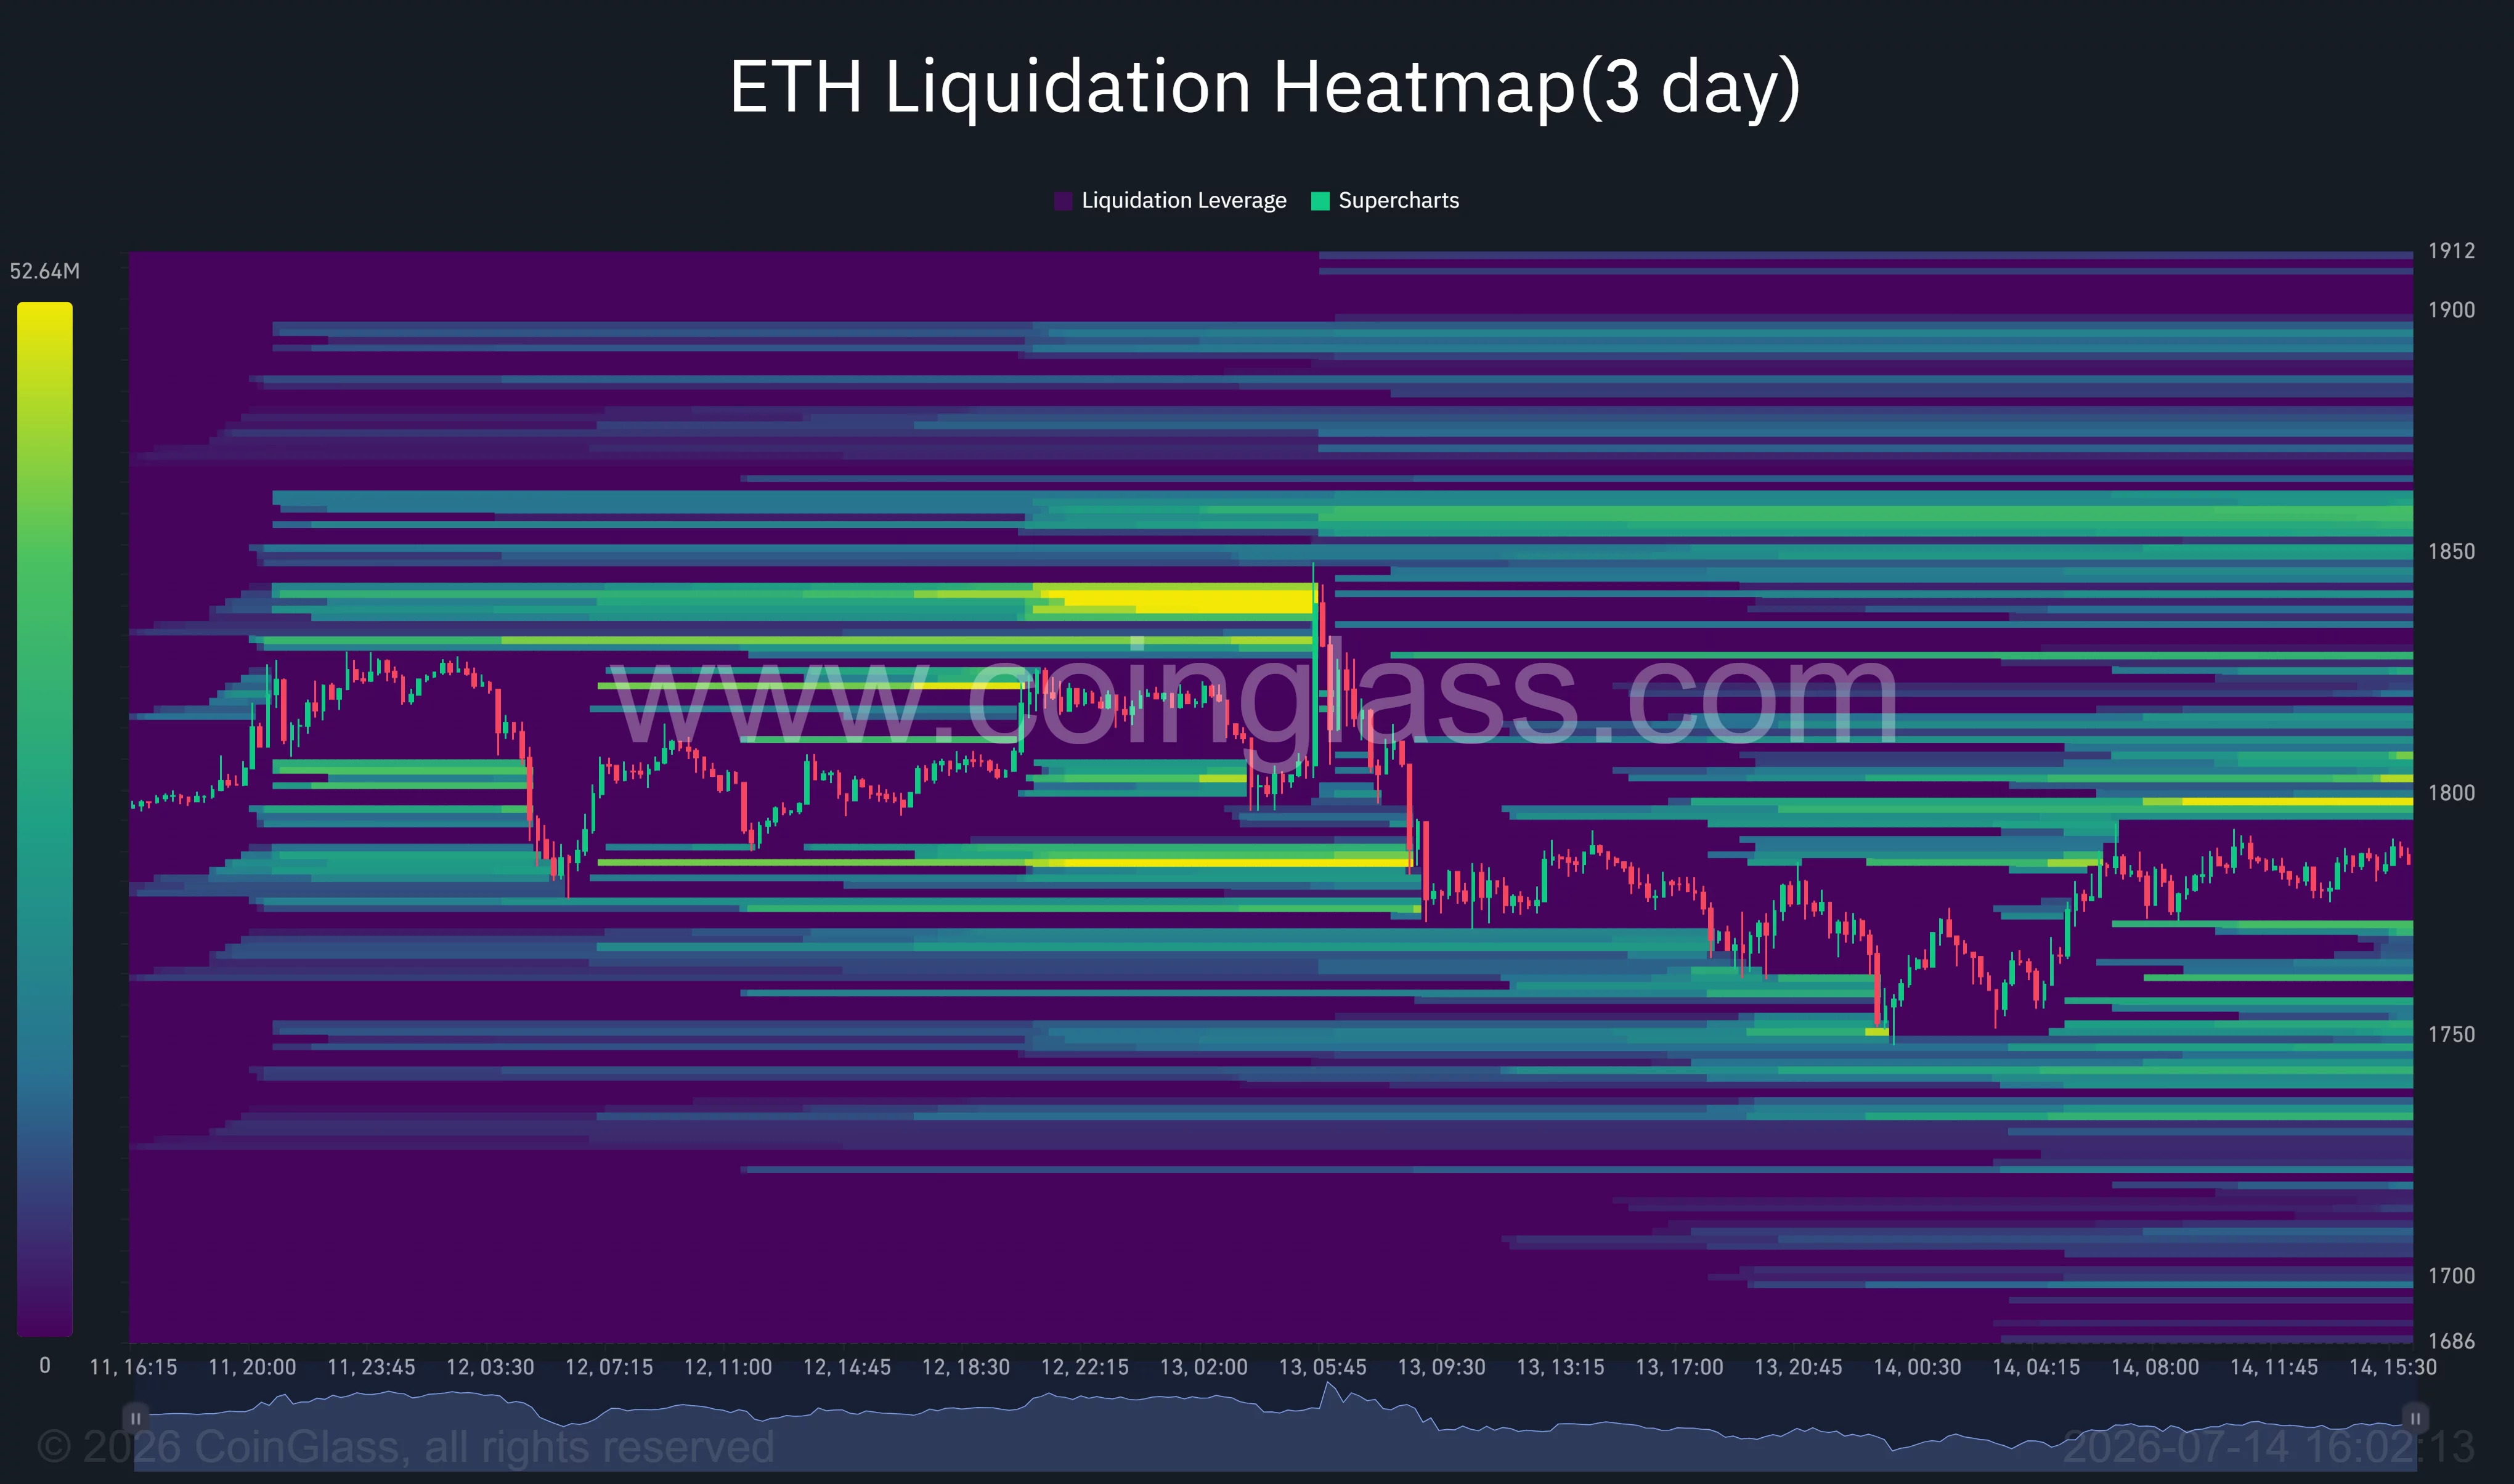
A decisive move through those levels could force short sellers to cover, accelerating momentum toward higher resistance. On the downside, liquidation pockets around $1,750 and below suggest sellers could regain control if support fails.
Ethereum needs a confirmed breakout above $1,850 to unlock higher targets
The daily chart shows Ethereum carving out what resembles a double-bottom formation after rebounding from June lows. Price now sits directly beneath horizontal resistance near $1,846, which coincides with the neckline of the pattern.
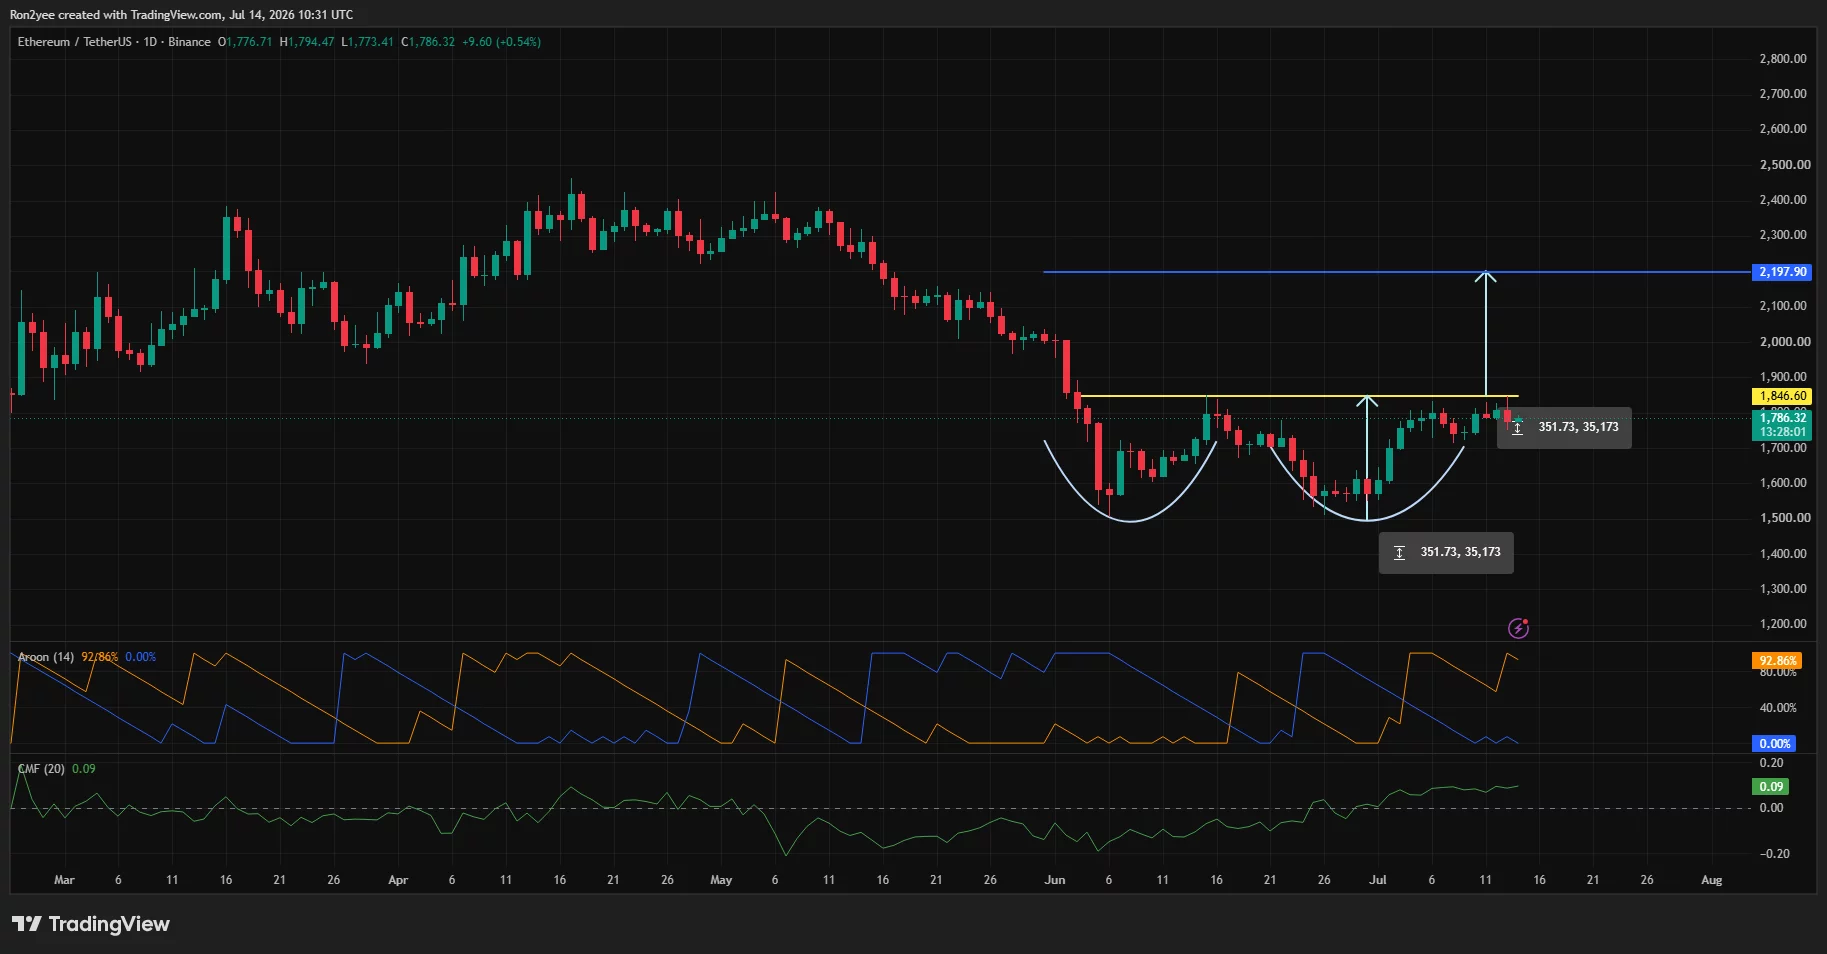
A successful breakout projects a measured move toward approximately $2,198, while the Aroon indicator favors buyers, with the bullish line holding above 90%. Chaikin Money Flow has also moved back into positive territory, suggesting capital has gradually returned after weeks of distribution.
Shorter-term momentum remains constructive but lacks confirmation. On the 4-hour chart, Ethereum continues to trade above the Supertrend support near $1,756, preserving the recent sequence of higher lows.
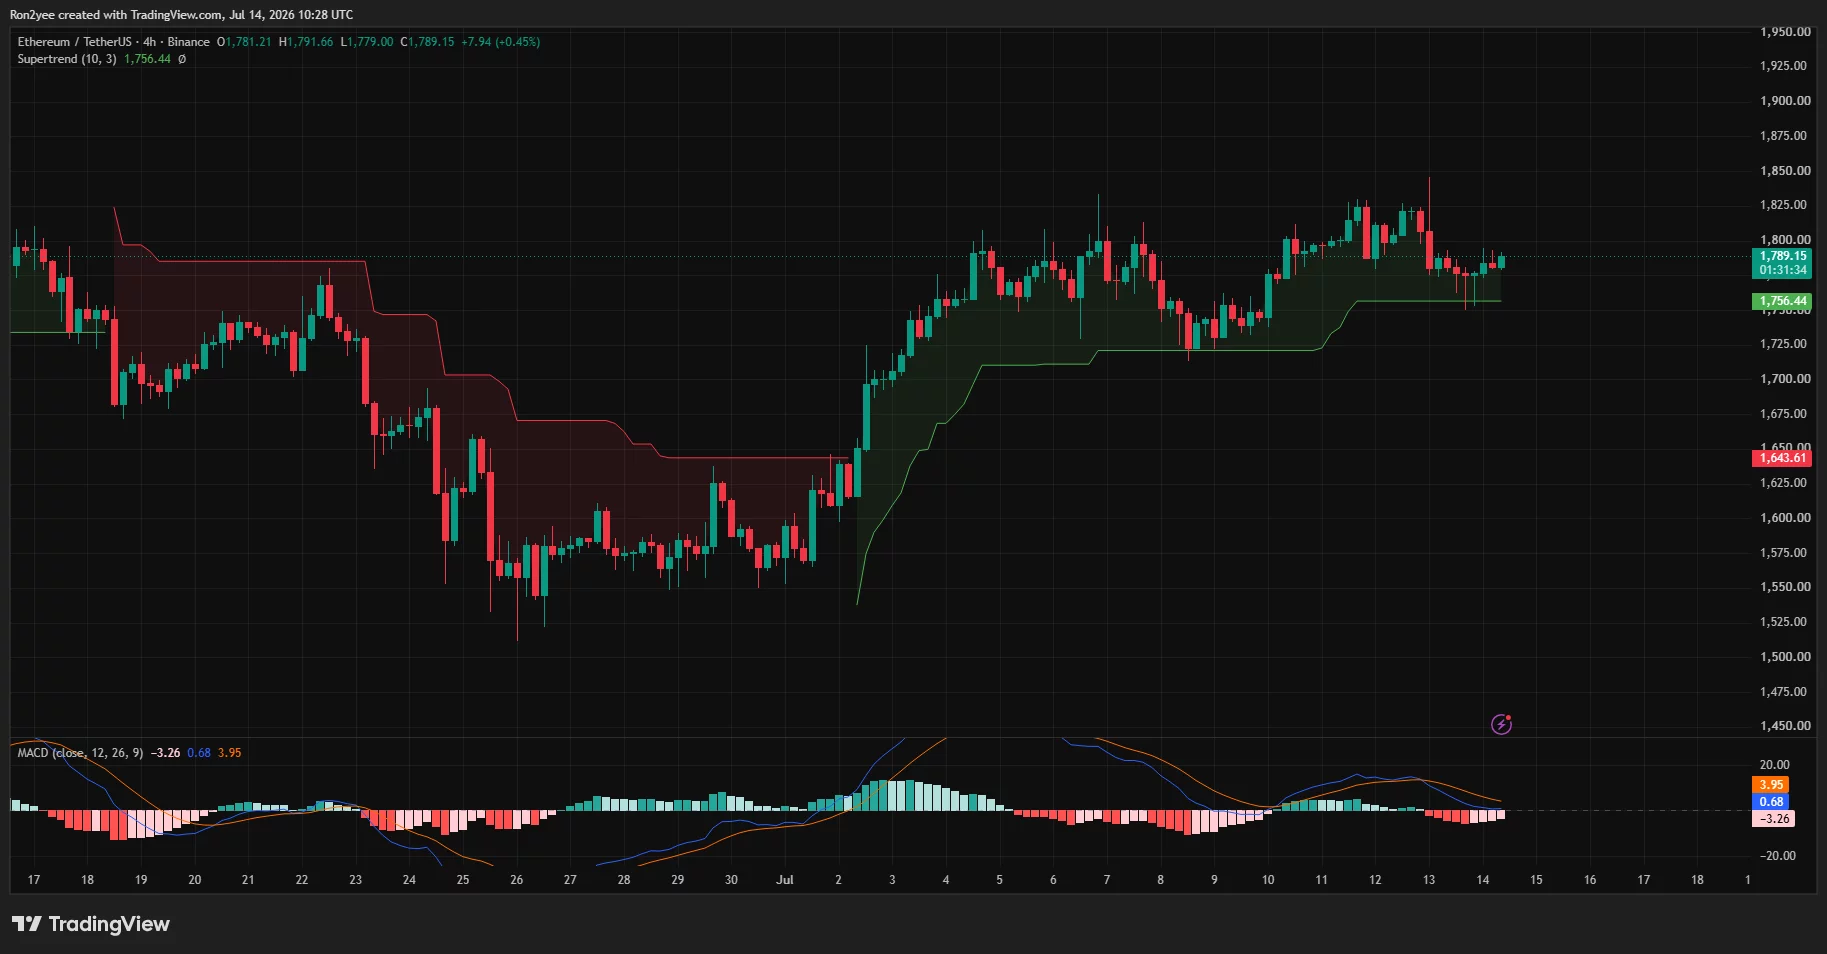
At the same time, the MACD histogram has weakened, and the MACD line has slipped beneath its signal line, showing that upside momentum has slowed as price approaches resistance rather than expanded into a fresh impulse.
Market participants are also watching the same technical level. According to analyst Ali Martinez, “I’m going LONG on Ethereum $ETH if it breaks $1,850.”
His view aligns with the neckline resistance visible on the daily chart, where a close above that level would invalidate the recent consolidation and expose the next objective near $2,200.
Another closely watched level sits slightly lower. Commenting on the latest structure, crypto analyst Ted Pillows argued that “$ETH held above its $1,750 support zone.” He added that buyers have defended the level and believes the next major move could develop to the upside as long as that floor remains intact.
Macro risks could quickly reverse Ethereum’s recovery
Even with the improving chart structure, macro conditions continue to dictate short-term direction. Ethereum has struggled to sustain rallies throughout 2026 as persistent spot ETF outflows, weaker network fee revenue following the Dencun upgrade, and competition from faster Layer-1 networks have weighed on investor demand.
Ethereum’s annual issuance has also returned to positive territory after reduced fee burns weakened the network’s deflationary narrative.
Failure to reclaim $1,800 before the CPI release would leave traders exposed to another round of volatility. A stronger-than-expected inflation print or renewed escalation in the Middle East could strengthen the U.S. dollar and Treasury yields, reducing appetite for crypto assets.
From a technical perspective, losing the $1,750-$1,756 support region would invalidate the current bullish setup and increase the probability of a retreat toward $1,680, with deeper demand waiting near the psychologically important $1,500 level.
Conversely, a confirmed break above $1,850 could trigger liquidations across leveraged short positions and shift attention toward the $1,900 area before the projected move toward $2,198 comes into focus.
Disclosure: This article does not represent investment advice. The content and materials featured on this page are for educational purposes only.