Solana price has recovered from recent market weakness, with bulls now attempting to overcome double-top resistance near the $100 level.
Summary
- Solana price traded near $87 as traders monitored whether mounting short liquidations and improving ETF sentiment could drive a breakout above $100.
- Morgan Stanley reportedly refiled a Solana ETF with staking support under the “MSOLsec” ticker, adding to institutional momentum around SOL products.
- Analysts identified heavy liquidation clusters between $90 and $95, while repeated double-top resistance continued capping Solana’s upside attempts.
Across the crypto market, risk appetite improved modestly after Bitcoin reclaimed ground above $77,000 following several sessions of macro-driven weakness tied to geopolitical tensions and volatility in oil markets.
The rebound helped major altcoins recover intraday losses, although traders remain cautious ahead of further U.S. inflation data and Federal Reserve commentary that could influence liquidity conditions across risk assets.
At the same time, institutional activity surrounding Solana has continued to strengthen despite the recent correction. A fresh catalyst emerged after Morgan Stanley reportedly refiled a Solana ETF product with staking support under the “MSOLsec” ticker, adding to growing expectations that regulated SOL investment vehicles could eventually mirror the success of spot Bitcoin and Ethereum products.
The filing arrived as asset managers continue expanding their exposure to staking-enabled crypto funds in search of yield-bearing digital assets.
Meanwhile, capital inflows into Solana-linked investment products have remained comparatively resilient during May’s choppy trading conditions. Products managed by firms such as Bitwise continued attracting attention from institutional allocators even as several other altcoins experienced declining flows.
Analysts say the ability of Solana products to maintain steady demand during a corrective phase suggests longer-term positioning rather than speculative short-term trading.
On-chain fundamentals have also remained constructive. In April 2026, Solana-based DePIN ecosystems generated a record combined revenue of roughly $2.9 million, according to ecosystem tracking data.
Projects including Helium, Render, and Hivemapper contributed heavily to the surge as decentralized infrastructure demand continued expanding across AI compute, mapping, and wireless connectivity markets.
Enterprise adoption narratives have continued building underneath the market. Payment giant Visa has already integrated Solana infrastructure into parts of its stablecoin settlement operations, while Meta has reportedly explored USDC-based creator payouts utilizing Solana rails. Traders increasingly view these commercial integrations as a long-term valuation support layer that differentiates Solana from purely speculative Layer-1 ecosystems.
Can Solana break through its double-top resistance structure?
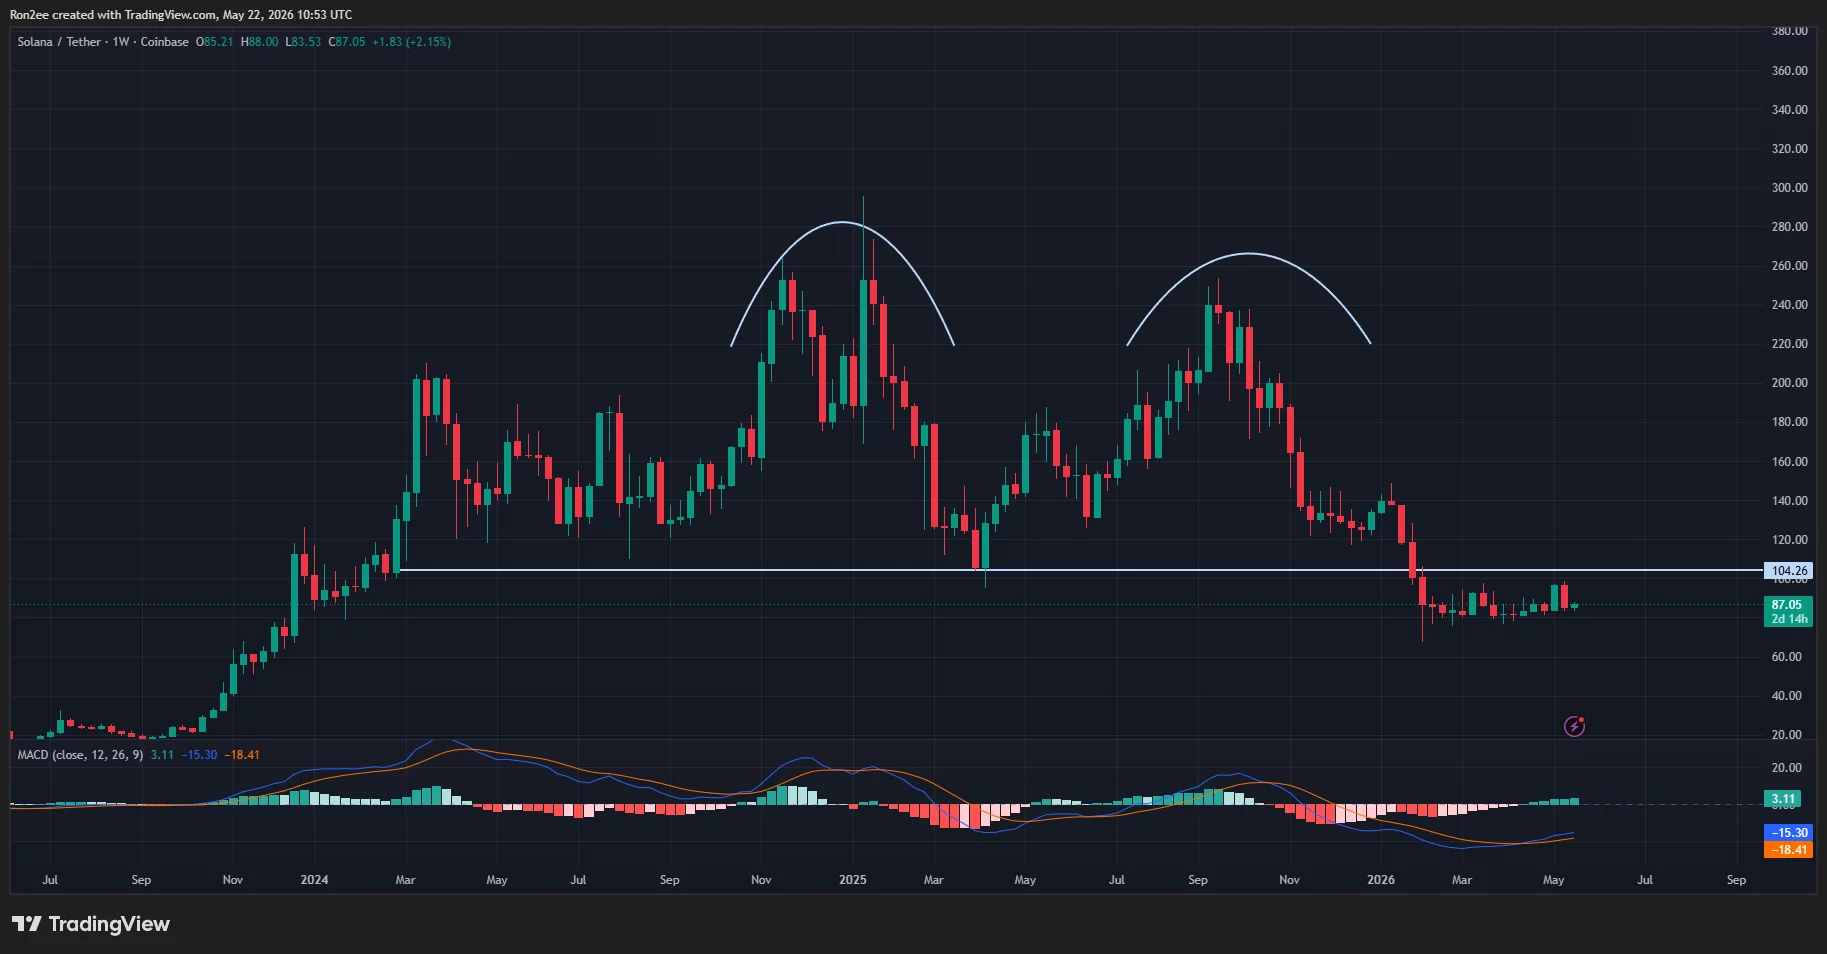
Solana remains trapped beneath a significant resistance zone after forming another local double-top pattern on both the daily and weekly timeframes. The charts show repeated rejection near the $95 to $100 region, an area that has capped upside attempts multiple times since late 2025.
On the daily chart, Solana (SOL) continues trading below the 200-day moving average near $107.89, while short-term moving averages around $86–$89 are beginning to flatten. Price action has compressed into a tight consolidation range after rejecting near $98 earlier this month, suggesting bulls and bears remain locked in a directional battle.
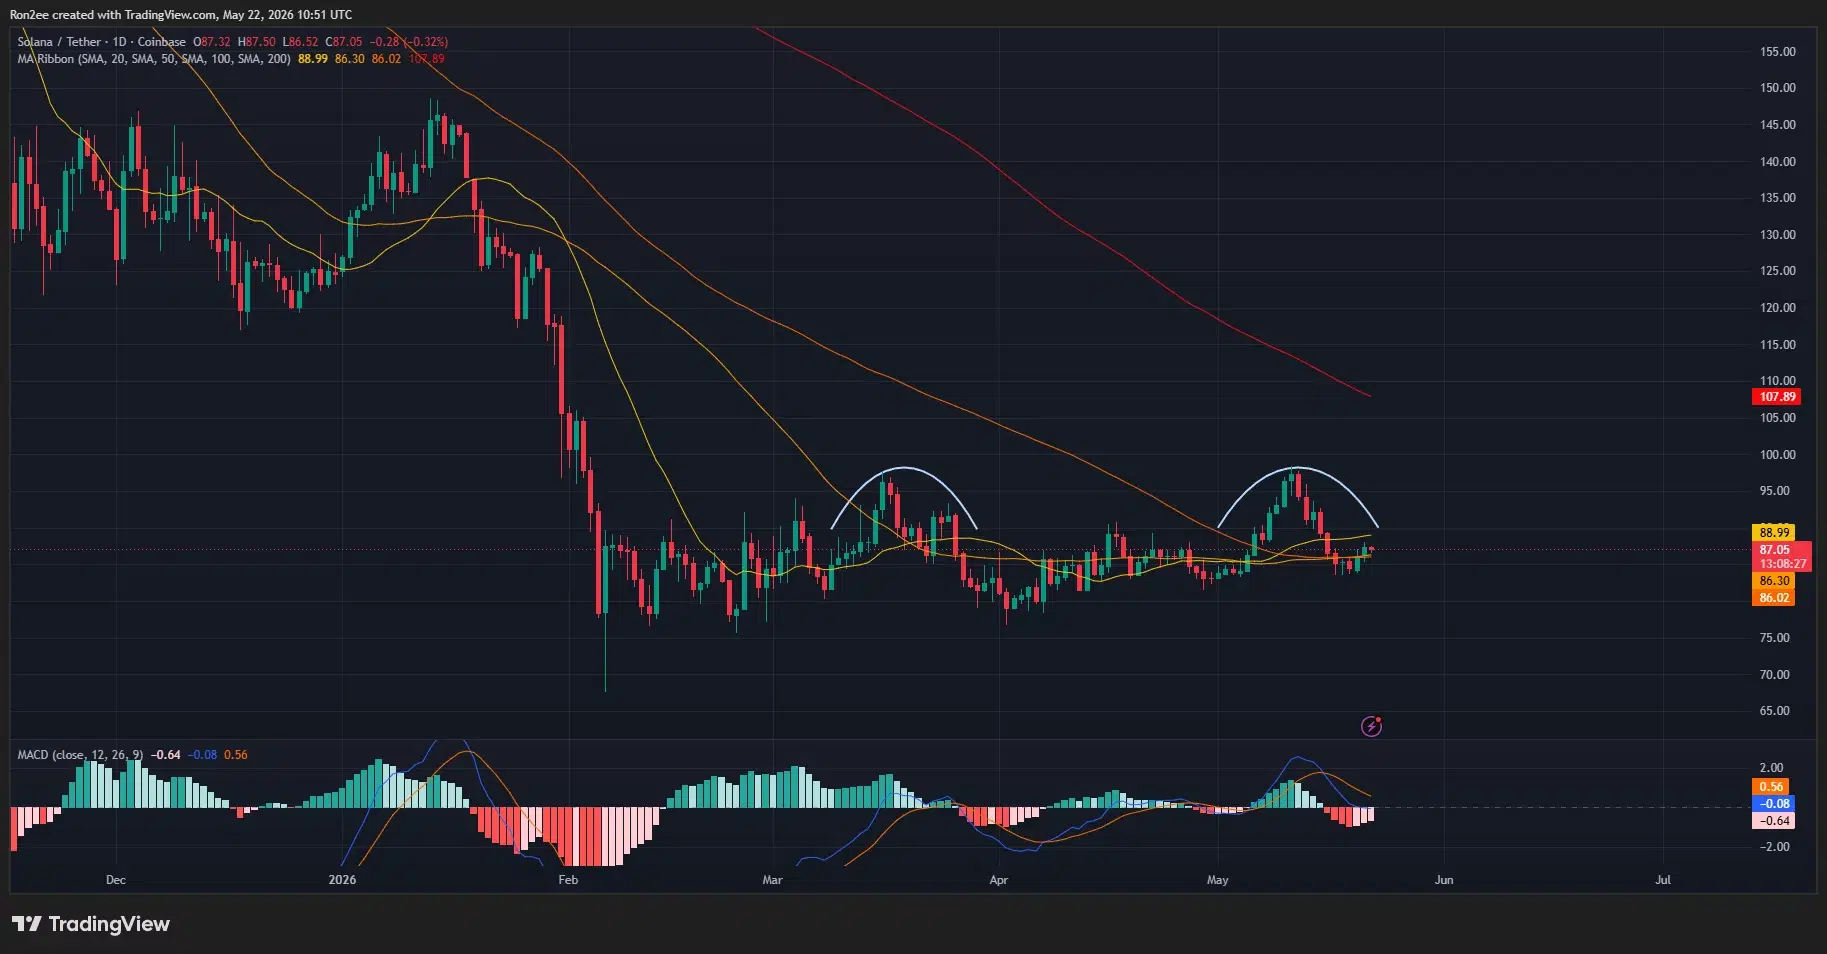
Momentum indicators have weakened but have not fully rolled over into bearish territory. The MACD histogram on the daily timeframe remains negative, although selling momentum has gradually faded over the past several sessions. Weekly MACD readings have also started stabilizing after months of persistent downside pressure, raising the possibility of a medium-term trend reversal if buyers reclaim higher resistance levels.
From a structural perspective, traders are closely monitoring the 0.382 Fibonacci retracement region between $87 and $90. Analysts view sustained closes above that area as an early confirmation that Solana may be transitioning out of its post-double-top consolidation phase. A breakout above $90 could expose liquidity near $95 before opening the path toward the key psychological barrier at $100.
According to analyst Javon Marks, Solana is once again holding a long-term support area that previously triggered explosive rallies. In a recent market update, Marks said one historical rebound from the level generated an 80% rally while another produced gains exceeding 270%.
“With prices showing strength off of this support level again, we are watching for an over 165% climb to test a key technical level at $233.8 again,” Marks wrote in a May 22 X post.
Beyond directional price action, derivatives positioning suggests a sharp volatility move could emerge if resistance levels begin failing. CoinGlass liquidation heatmaps show dense liquidation clusters concentrated between $90 and $95, with another large band sitting just above current price levels.
A decisive move into that region could trigger forced short liquidations and accelerate upside momentum through a classic squeeze setup. Market data cited by traders indicates short sellers recently absorbed nearly five times more liquidation pressure than longs.
Open interest has also started rising gradually after several weeks of deleveraging, suggesting traders are rebuilding directional positions ahead of a potential breakout attempt. Funding rates, while not excessively bullish, have stabilized near neutral territory, a setup many derivatives traders consider healthier than heavily crowded long positioning.
Meanwhile, Solana’s total value locked has shown signs of stabilizing after months of contraction. Analysts tracking on-chain liquidity argue that a sustained TVL recovery would likely strengthen spot demand for SOL tokens while reinforcing confidence in Solana’s decentralized finance ecosystem. Historically, periods of expanding TVL have coincided with stronger medium-term price performance for SOL.
What could invalidate Solana’s bullish breakout thesis?
Despite improving sentiment, several downside risks continue threatening the bullish setup. The most immediate concern remains Bitcoin’s fragile position near major support levels as global macro uncertainty continues pressuring risk assets.
Oil markets remain highly sensitive to developments surrounding U.S.-Iran negotiations and shipping disruptions near the Strait of Hormuz. Any renewed spike in crude prices could reignite inflation concerns and reduce expectations for Federal Reserve rate cuts, creating another wave of risk-off pressure across crypto markets.
At the same time, Solana’s technical structure still carries meaningful bearish risk unless buyers reclaim the $95–$100 resistance band decisively. Repeated rejections beneath double-top resistance often weaken bullish momentum over time, particularly if accompanied by declining spot demand.
Failure to hold the $84–$85 support region could expose lower liquidity zones near $80 and potentially reopen the path toward the March lows. CoinGlass heatmap data already shows notable downside liquidation pockets sitting below current prices, meaning volatility could accelerate rapidly if sellers regain control.
The longer-term weekly chart also shows SOL continuing to trade well below its 2025 highs despite recent stabilization. Until the asset reclaims the major breakdown region near $104, some traders may continue treating rallies as temporary relief bounces within a larger bearish market structure.
Still, improving institutional narratives, expanding enterprise adoption, growing DePIN revenues, and mounting short-side leverage continue giving bulls a credible case for another breakout attempt.
If Bitcoin stabilizes and macro conditions avoid further deterioration, Solana may soon test whether the market still has enough momentum to finally clear the stubborn double-top ceiling and reclaim triple-digit territory.
Disclosure: This article does not represent investment advice. The content and materials featured on this page are for educational purposes only.