

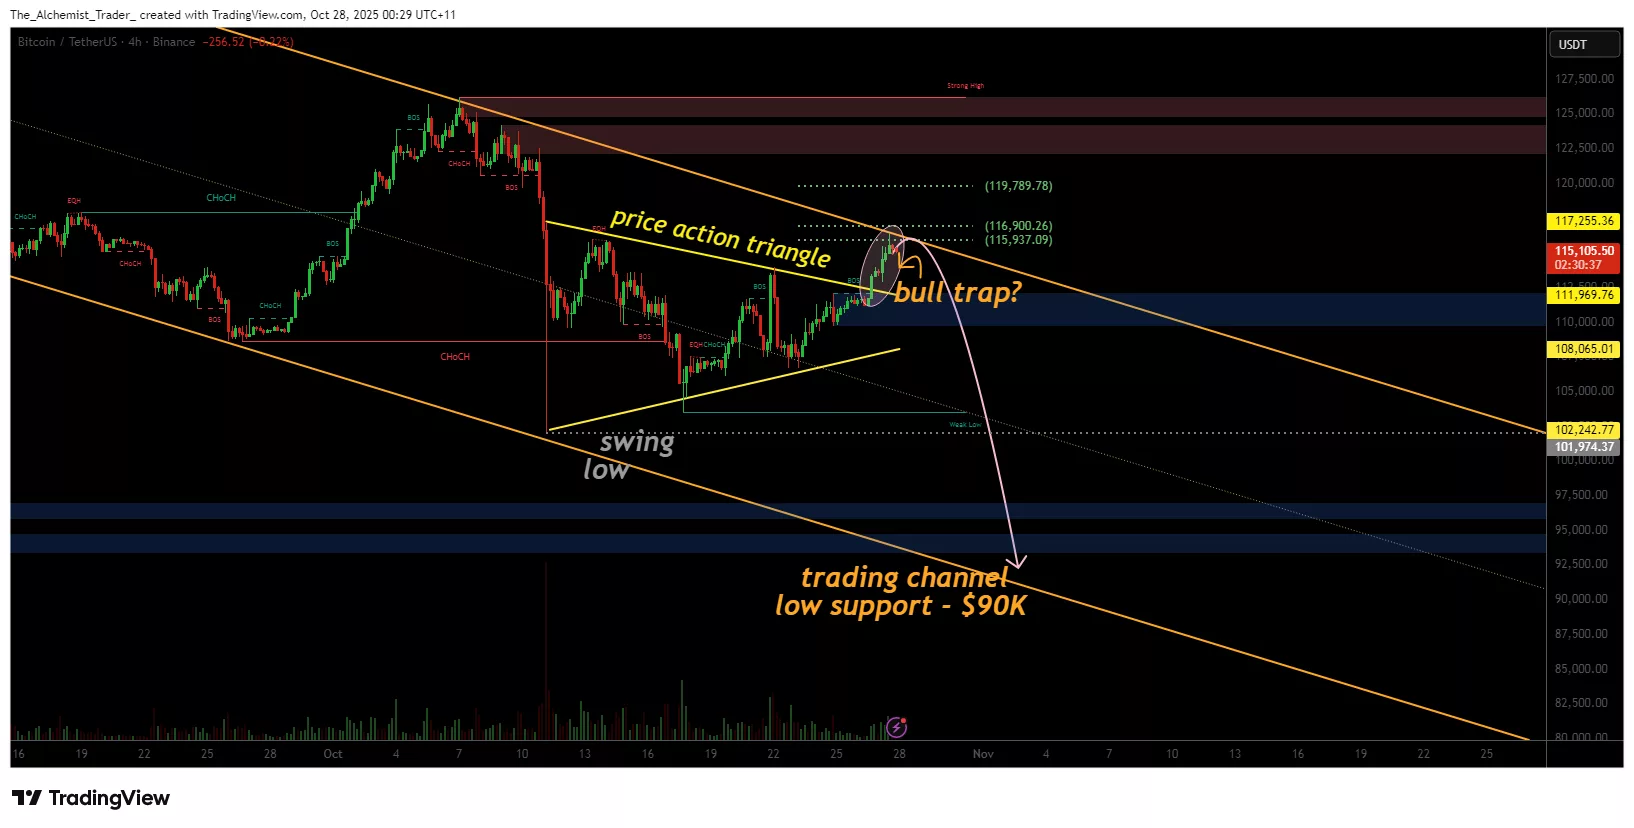
Bitcoin price breaks out of a local triangle pattern and rallies toward $115,000, but the move faces major resistance at the channel high where a potential bull trap could emerge.
Summary
- Bitcoin breaks out of local triangle consolidation with bullish momentum.
- $115,000 channel high acts as key resistance and potential bull trap zone.
- A confirmed breakout targets $125,000–$130,000, while rejection risks retracement to $90,000.
Bitcoin (BTC) price has successfully broken out of a local triangle pattern, confirming short-term bullish momentum as price surges toward the $115,000 channel resistance. This breakout marks a key technical development following weeks of consolidation within a narrowing range.
However, while the move confirms a bullish continuation pattern, the $115,000 resistance zone remains a critical inflection point where a bull trap could potentially form if price fails to sustain above it.
Bitcoin price key technical points:
- Triangle Breakout: Bitcoin breaks out of a local ascending triangle, confirming short-term bullish strength.
- Major Resistance: $115,000 forms the upper boundary of the current trading channel.
- Bull Trap Risk: A rejection at $115,000 could trigger a false breakout and rotation toward $90,000.
Bitcoin’s triangle breakout has injected fresh bullish energy into the market, propelling price toward the $115,000 resistance zone, the current channel high. The breakout followed several weeks of tightening consolidation, where volatility compressed within a well-defined triangle. The upward break signals renewed buying interest, but this move now faces a decisive test at major resistance.
The $115,000 level represents both a psychological and structural barrier, acting as the top of Bitcoin’s ascending trading channel. Historically, moves into this region have resulted in temporary slowdowns or corrections, particularly when accompanied by declining volume.
If Bitcoin fails to close above this level with strength, it could form a bull trap, catching late buyers before rotating lower toward support zones at $102,000 and $90,000.Volume confirmation remains key, a breakout above $115,000 with low or flat volume would suggest a lack of conviction and increase the risk of a trap scenario.
Conversely, if Bitcoin breaks and holds above the resistance with strong volume expansion, it could invalidate the bull trap setup and pave the way for a push toward $125,000–$130,000.
Should rejection occur at $115,000, Bitcoin could retrace toward mid-range levels before re-establishing momentum. This would maintain the broader bullish structure while flushing out overextended positions, a common characteristic of bull traps during strong uptrends.
What to expect in the coming price action
If Bitcoin holds its triangle breakout momentum and breaks decisively above $115,000, the move could accelerate toward $125,000–$130,000, confirming continuation of the macro uptrend. However, a failure to maintain this level could trigger a bull trap, leading to a pullback toward $102,000–$90,000 before another attempt higher.