

Bitcoin holds steady above $117,000, and Ethereum is trading close to $4,500 on Friday. Several altcoins like OKB, KuCoin, Cardano, Hyperliquid and Arbitrum posted double-digit rallies in the past seven days.
Summary
- OKB rallied over 100% in the last seven days, in anticipation of half the supply burning on Friday, August 15.
- KuCoin gained nearly 20% as traders fueled demand in response to the $2 billion “Trust Project” initiative.
- Cardano posted 20% gains in the same timeframe, as Bitcoin and Ethereum rallied this week.
- Hyperliquid price is up 15% and the token is close to $30 billion in daily volume catalyzed by whale accumulation.
- Arbitrum price climbed 10% in the last seven days with institutional adoption, alongside Bitcoin and Ethereum.
Top 5 altcoin price analysis
Among the top 100 cryptocurrencies, OKB (OKB), KuCoin (KCS), Cardano (ADA), Hyperliquid (HYPE) and Arbitrum (ARB) gained between 10% and 100% in the past seven days.
While the top two cryptos, Bitcoin (BTC) and Ethereum (ETH) climbed as traders turned bullish, speculation of an altcoin season is brewing mid-August.

Cardano
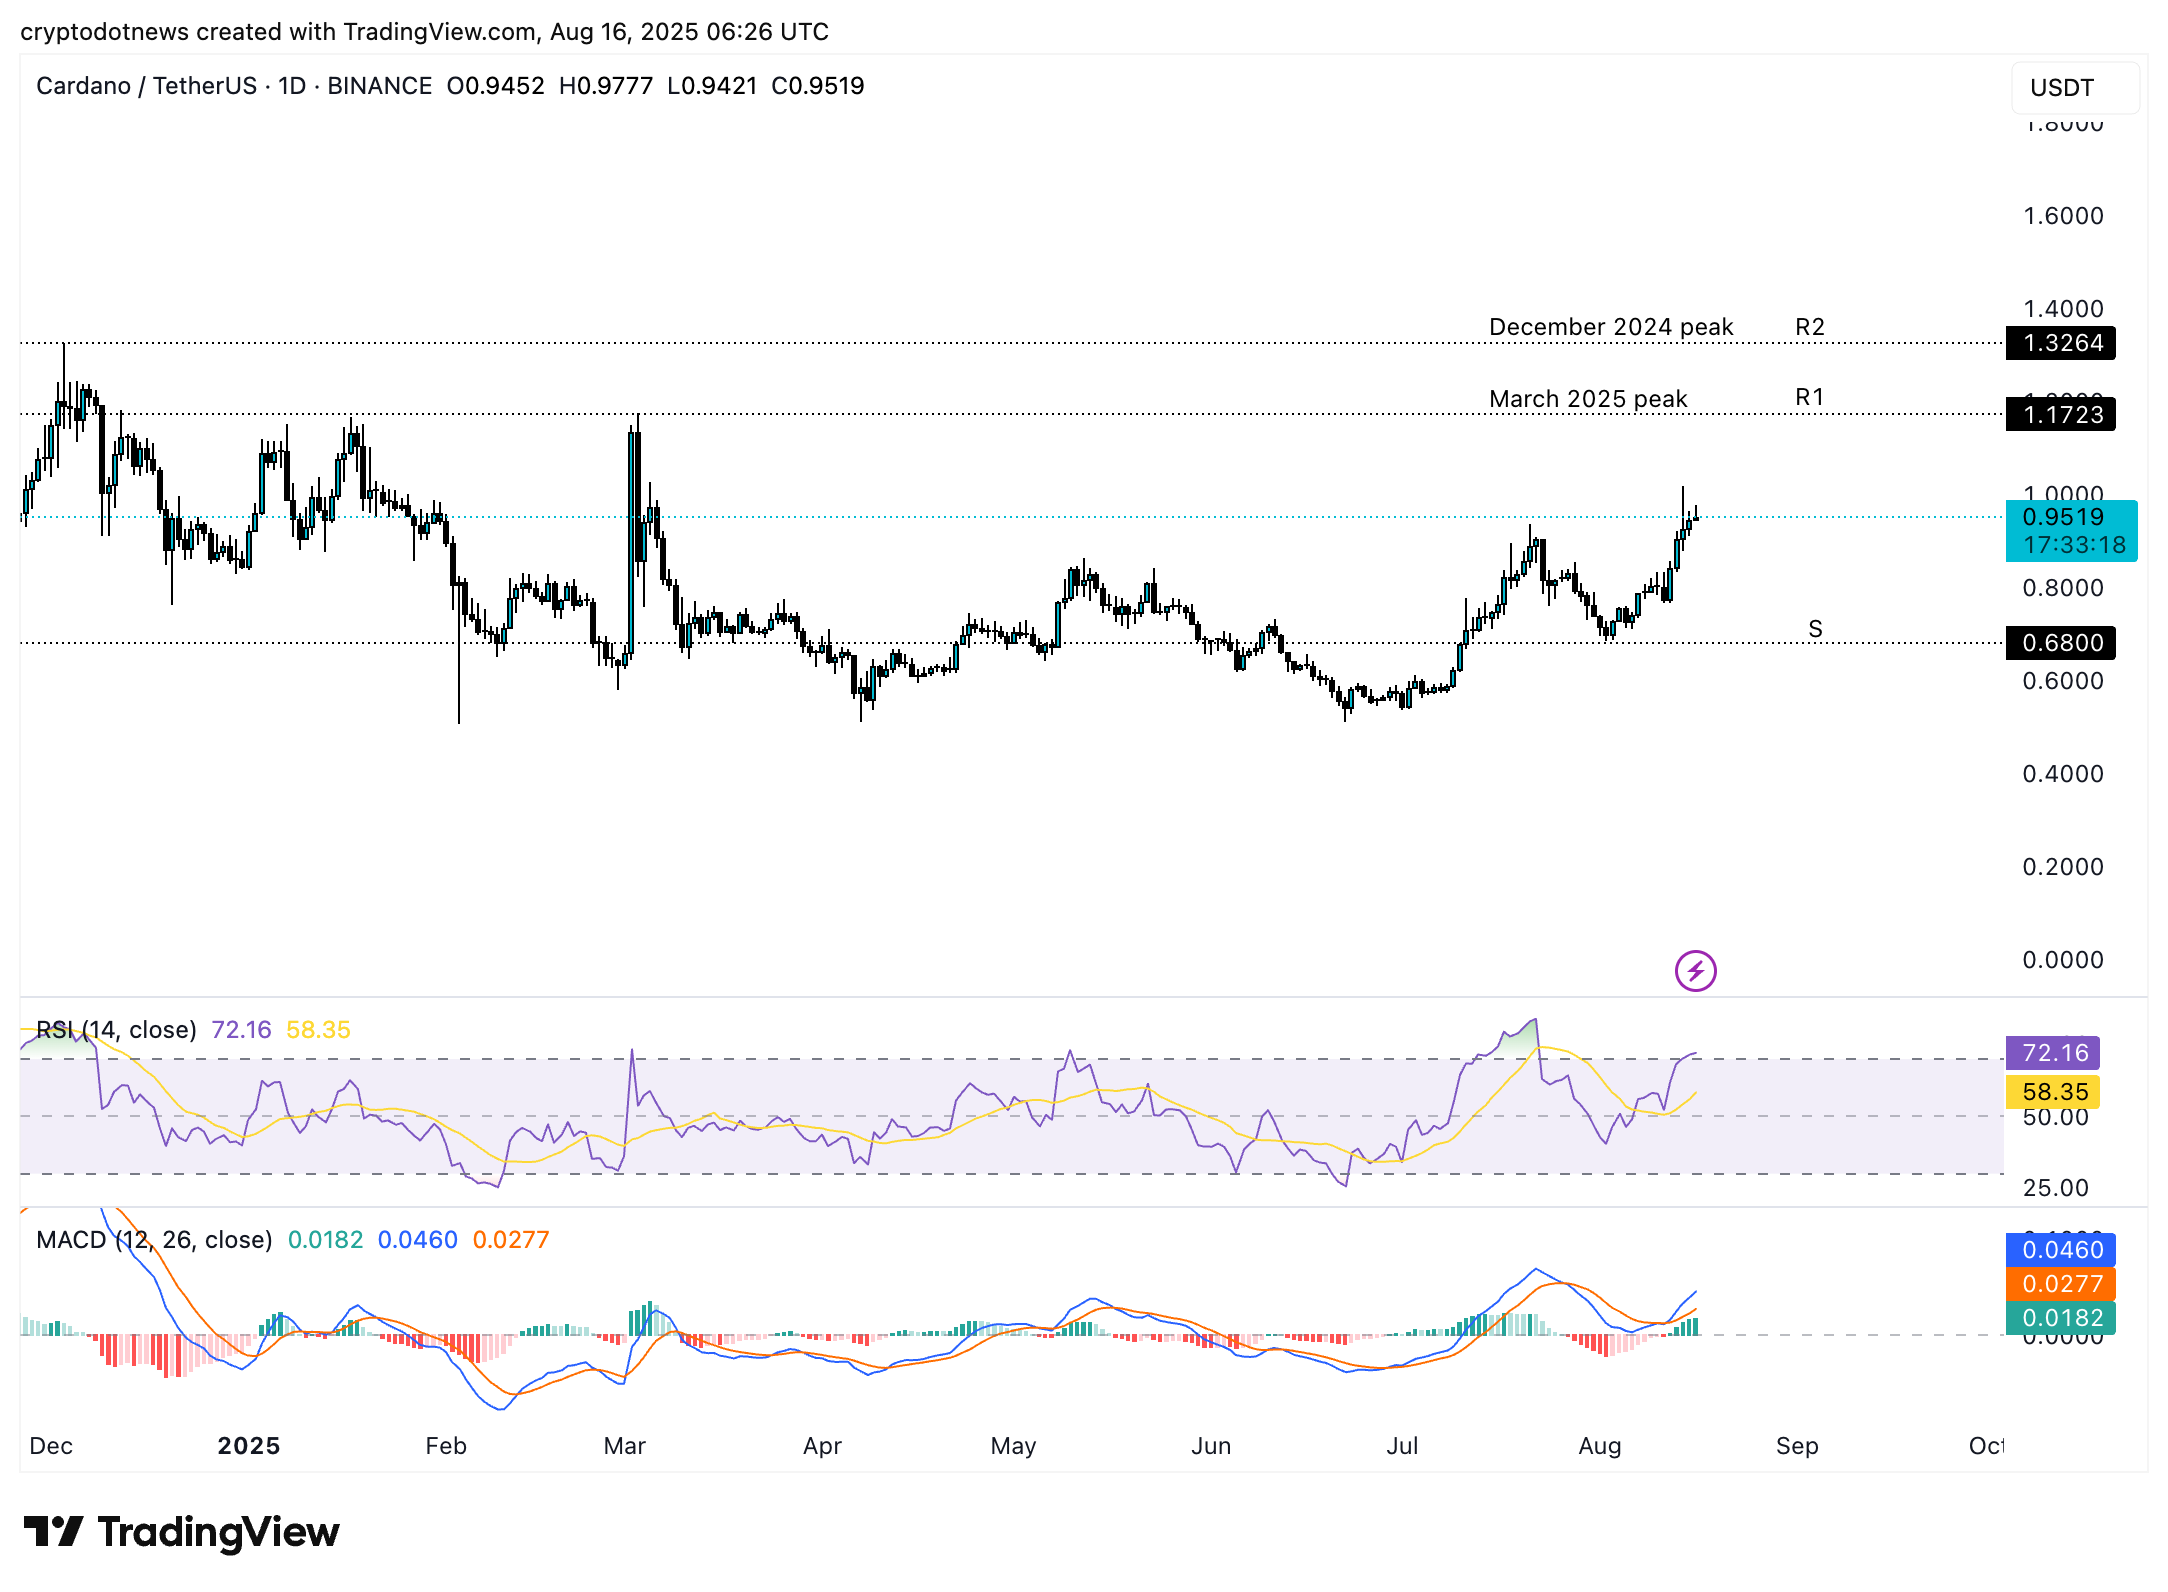
Cardano is currently trading at $0.9517, just shy of the psychologically important $1 level. Two key resistances for ADA are R1 and R2, at $1.1723 and $1.3264, respectively. Momentum indicators RSI and MACD support a bullish thesis for ADA.
In the event of a correction, ADA could sweep support at $0.6800, as seen in the ADA/USDT daily price chart below.
KuCoin
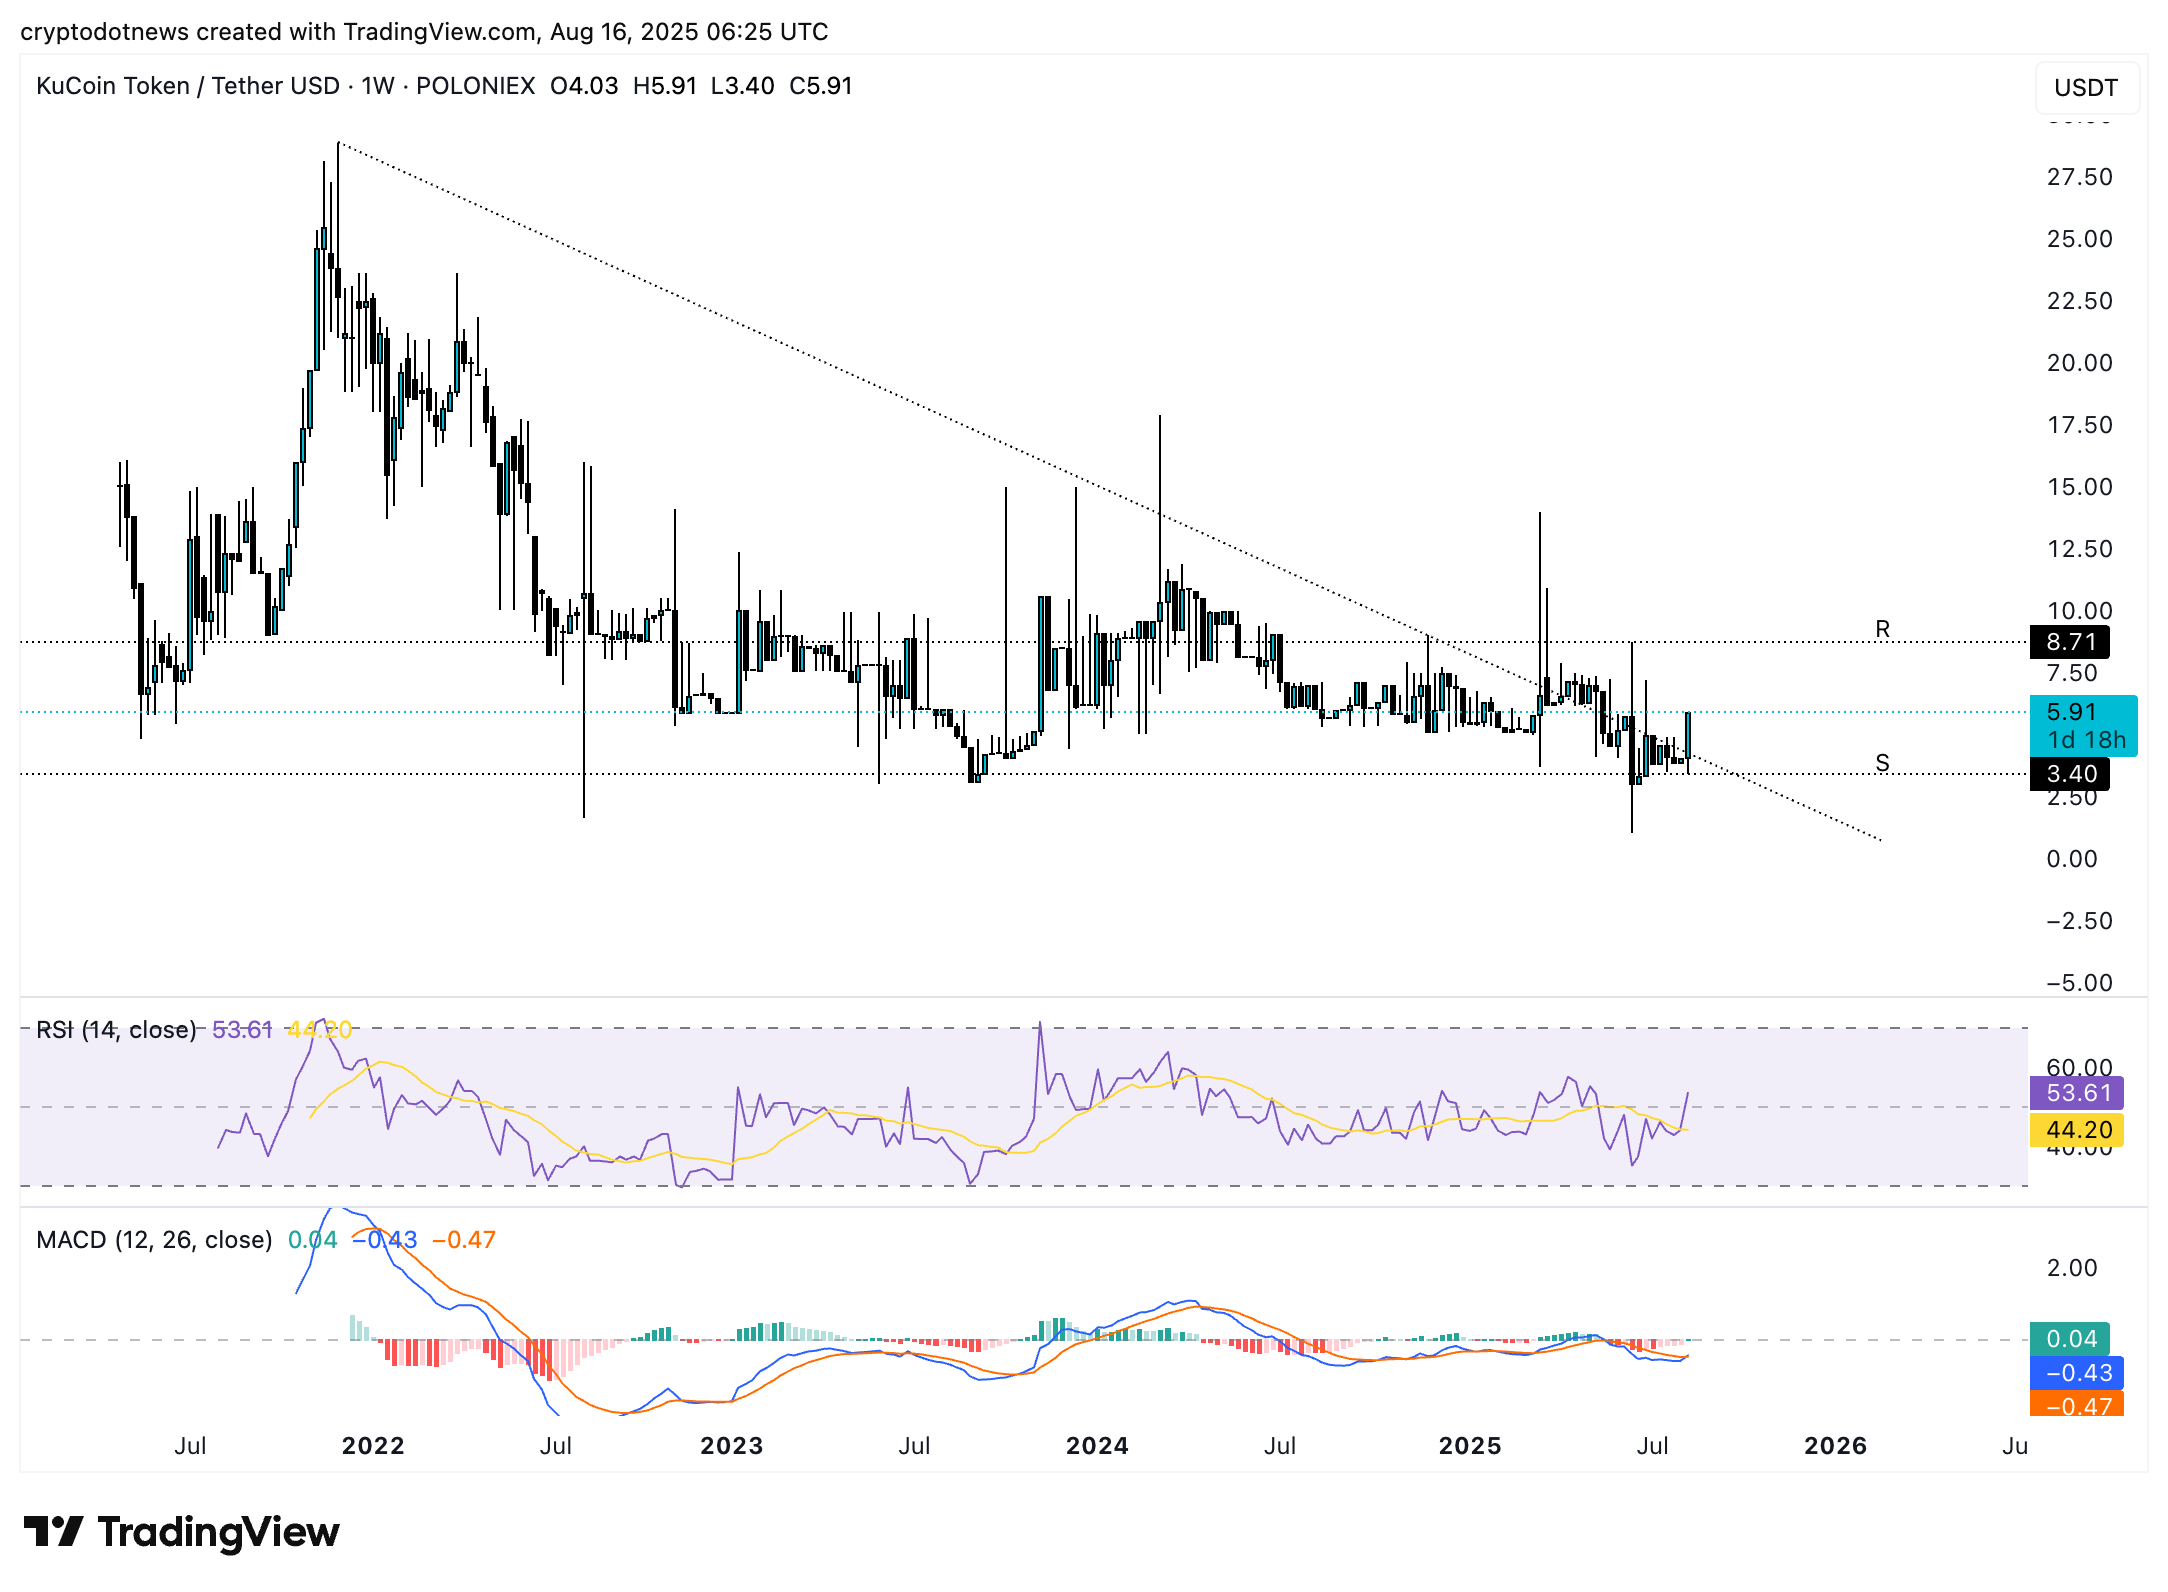
KuCoin’s KCS token could rally; the setup is similar to ADA. The closest resistance is at $8.71 and the nearest support is $3.40. Traders are expected to watch both levels, even though the momentum indicators support an extension of KCS price rally in the coming week.
KCS is trading at $5.91 at the time of writing.
OKB
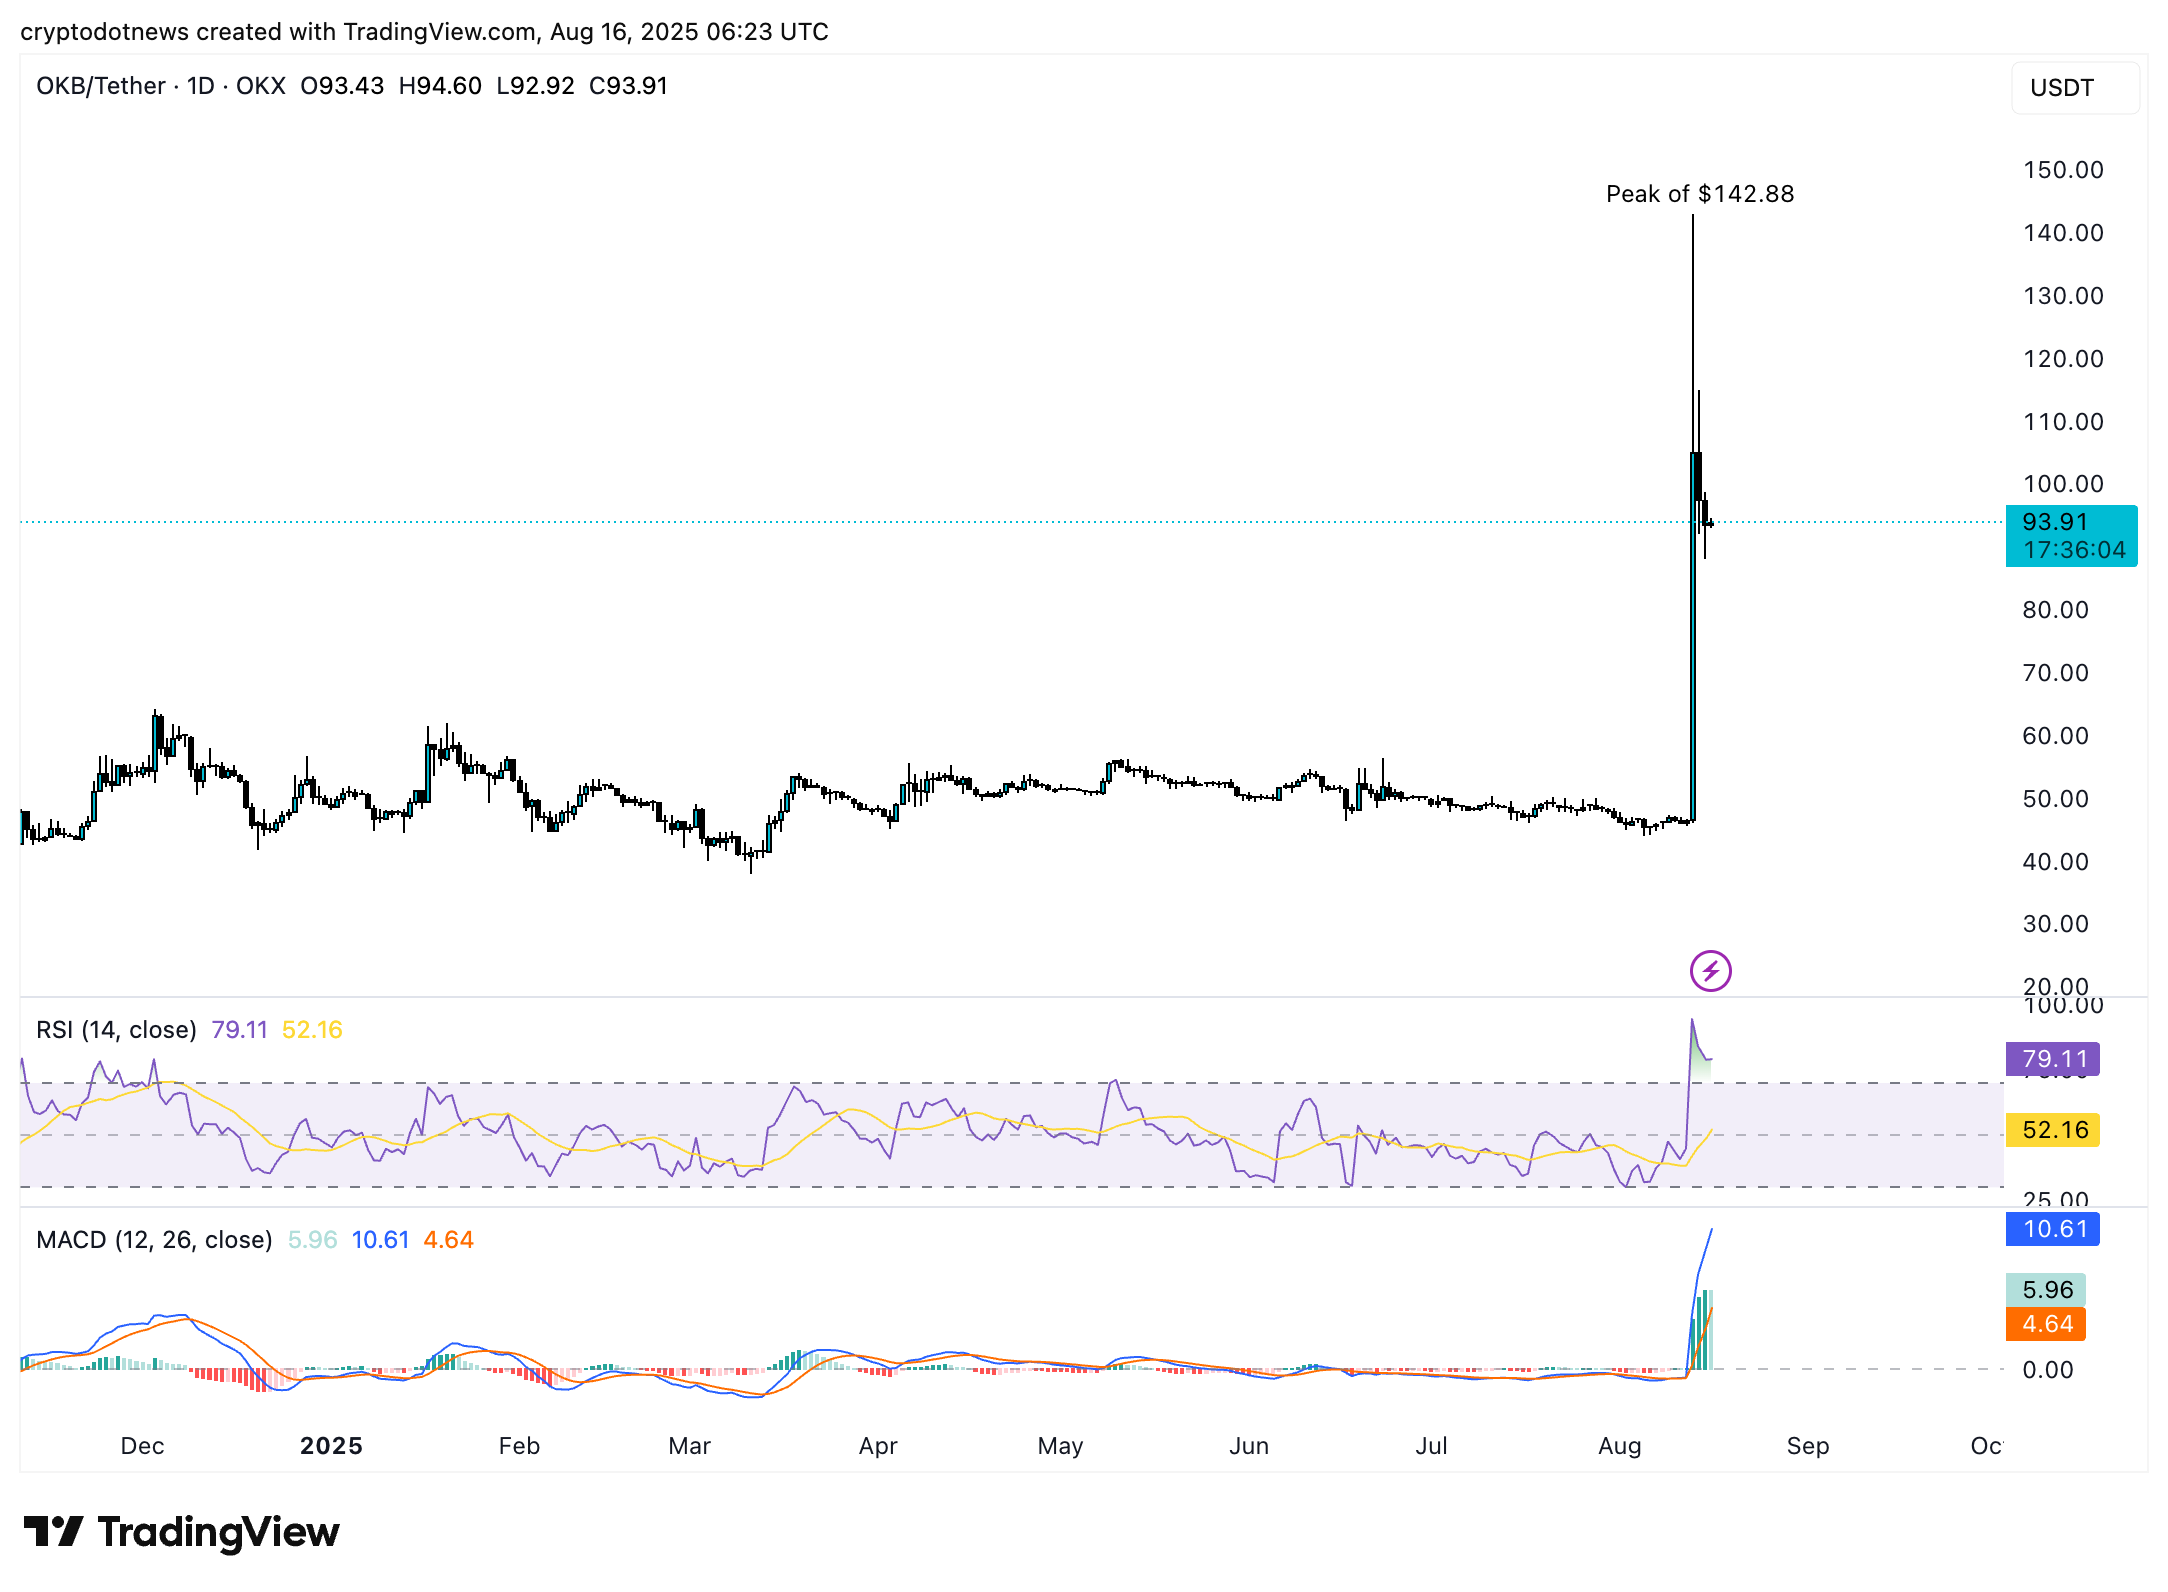
OKB is trading at $93.91 at the time of writing. The native token of the OKX exchange could revisit its recent peak at $142.88 if it climbs higher. The momentum indicators support gains in OKB and the token could extend its rally.
RSI indicates OKB is currently overvalued; a drop under 70 could generate a sell signal. Traders should watch MACD for signs of a trend reversal in the native token of the exchange.
HYPE
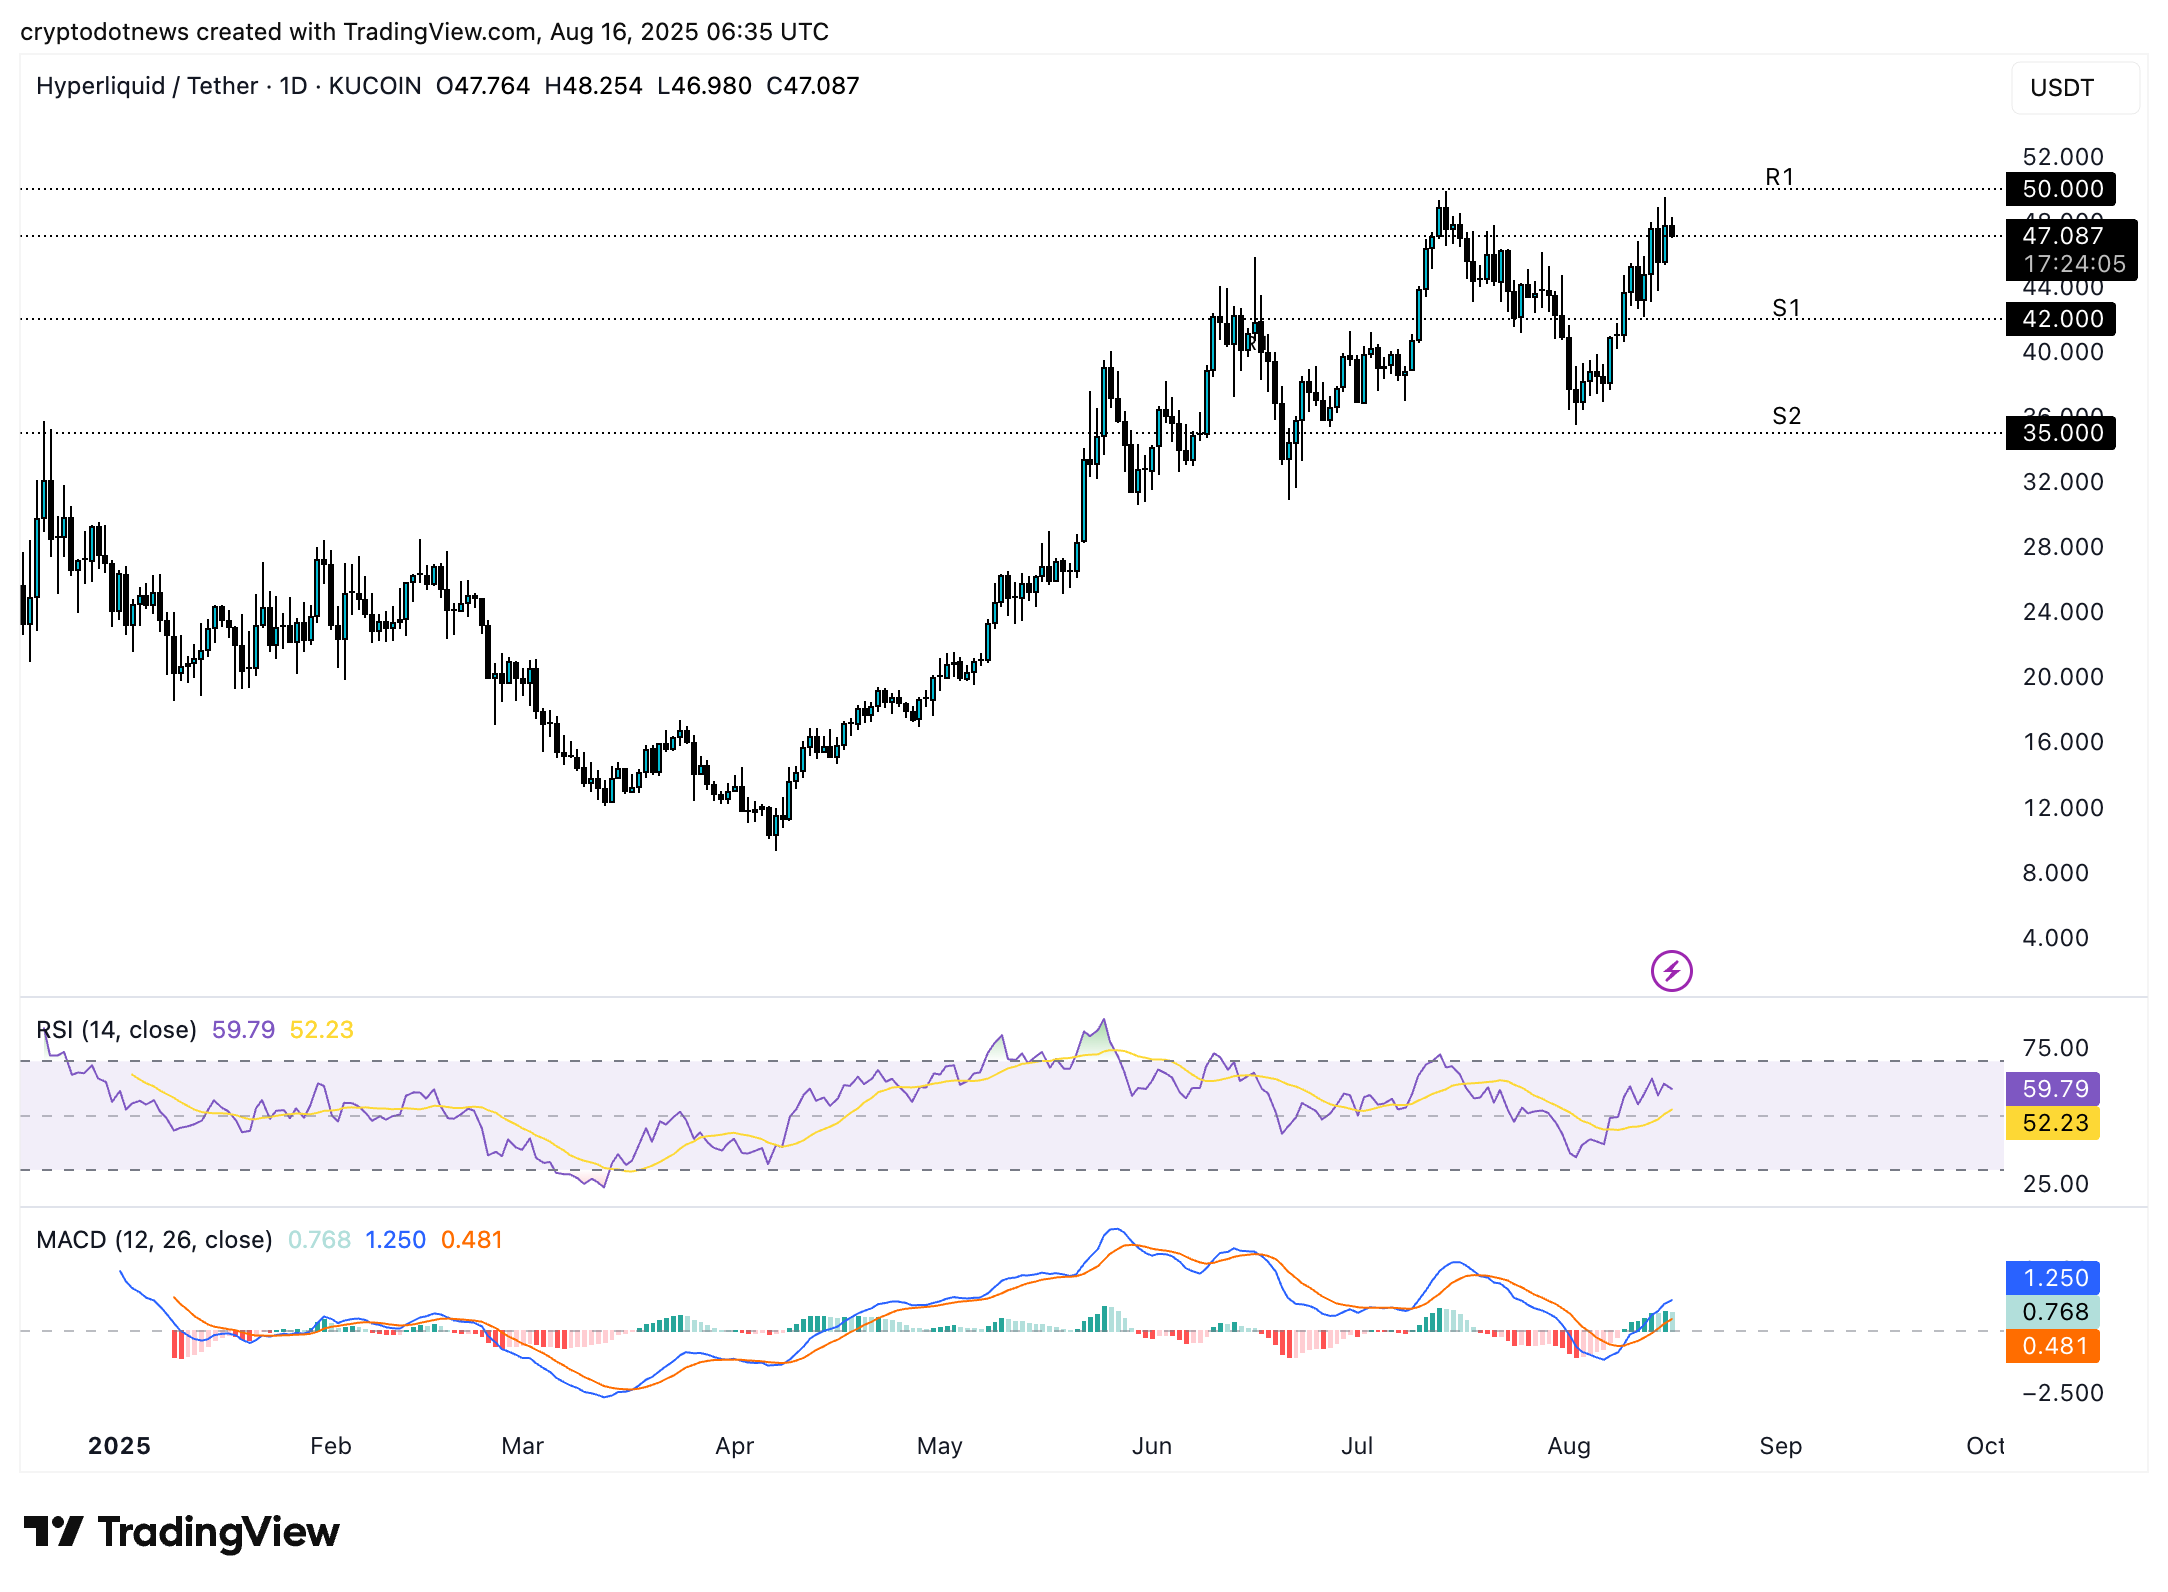
HYPE could test resistance at R1, the closest resistance level to the current price at $50. HYPE is trading at $47.087 at the time of writing. The two closest support levels to HYPE are $42 and $35, marked in the HYPE/USDT daily price chart below.
HYPE’s daily price chart supports a bullish thesis for the token. RSI reads 59 and is sloping upwards. MACD flashes consecutively taller green histogram bars, signaling an underlying positive momentum in HYPE’s price trend.
State of altcoin season
The altcoin season index reads 47 on a scale from 0 to 100. A reading of 75 and above means it is officially altcoin season, a time period in which over 75% of the top 100 altcoins outperform Bitcoin in a 90 day reference frame.
Over 249 days have officially passed since the last altcoin season.

The index shows that it was Bitcoin season prior to July 2025, at the time of writing the market is between Bitcoin and altcoin season, with a reading of 47.
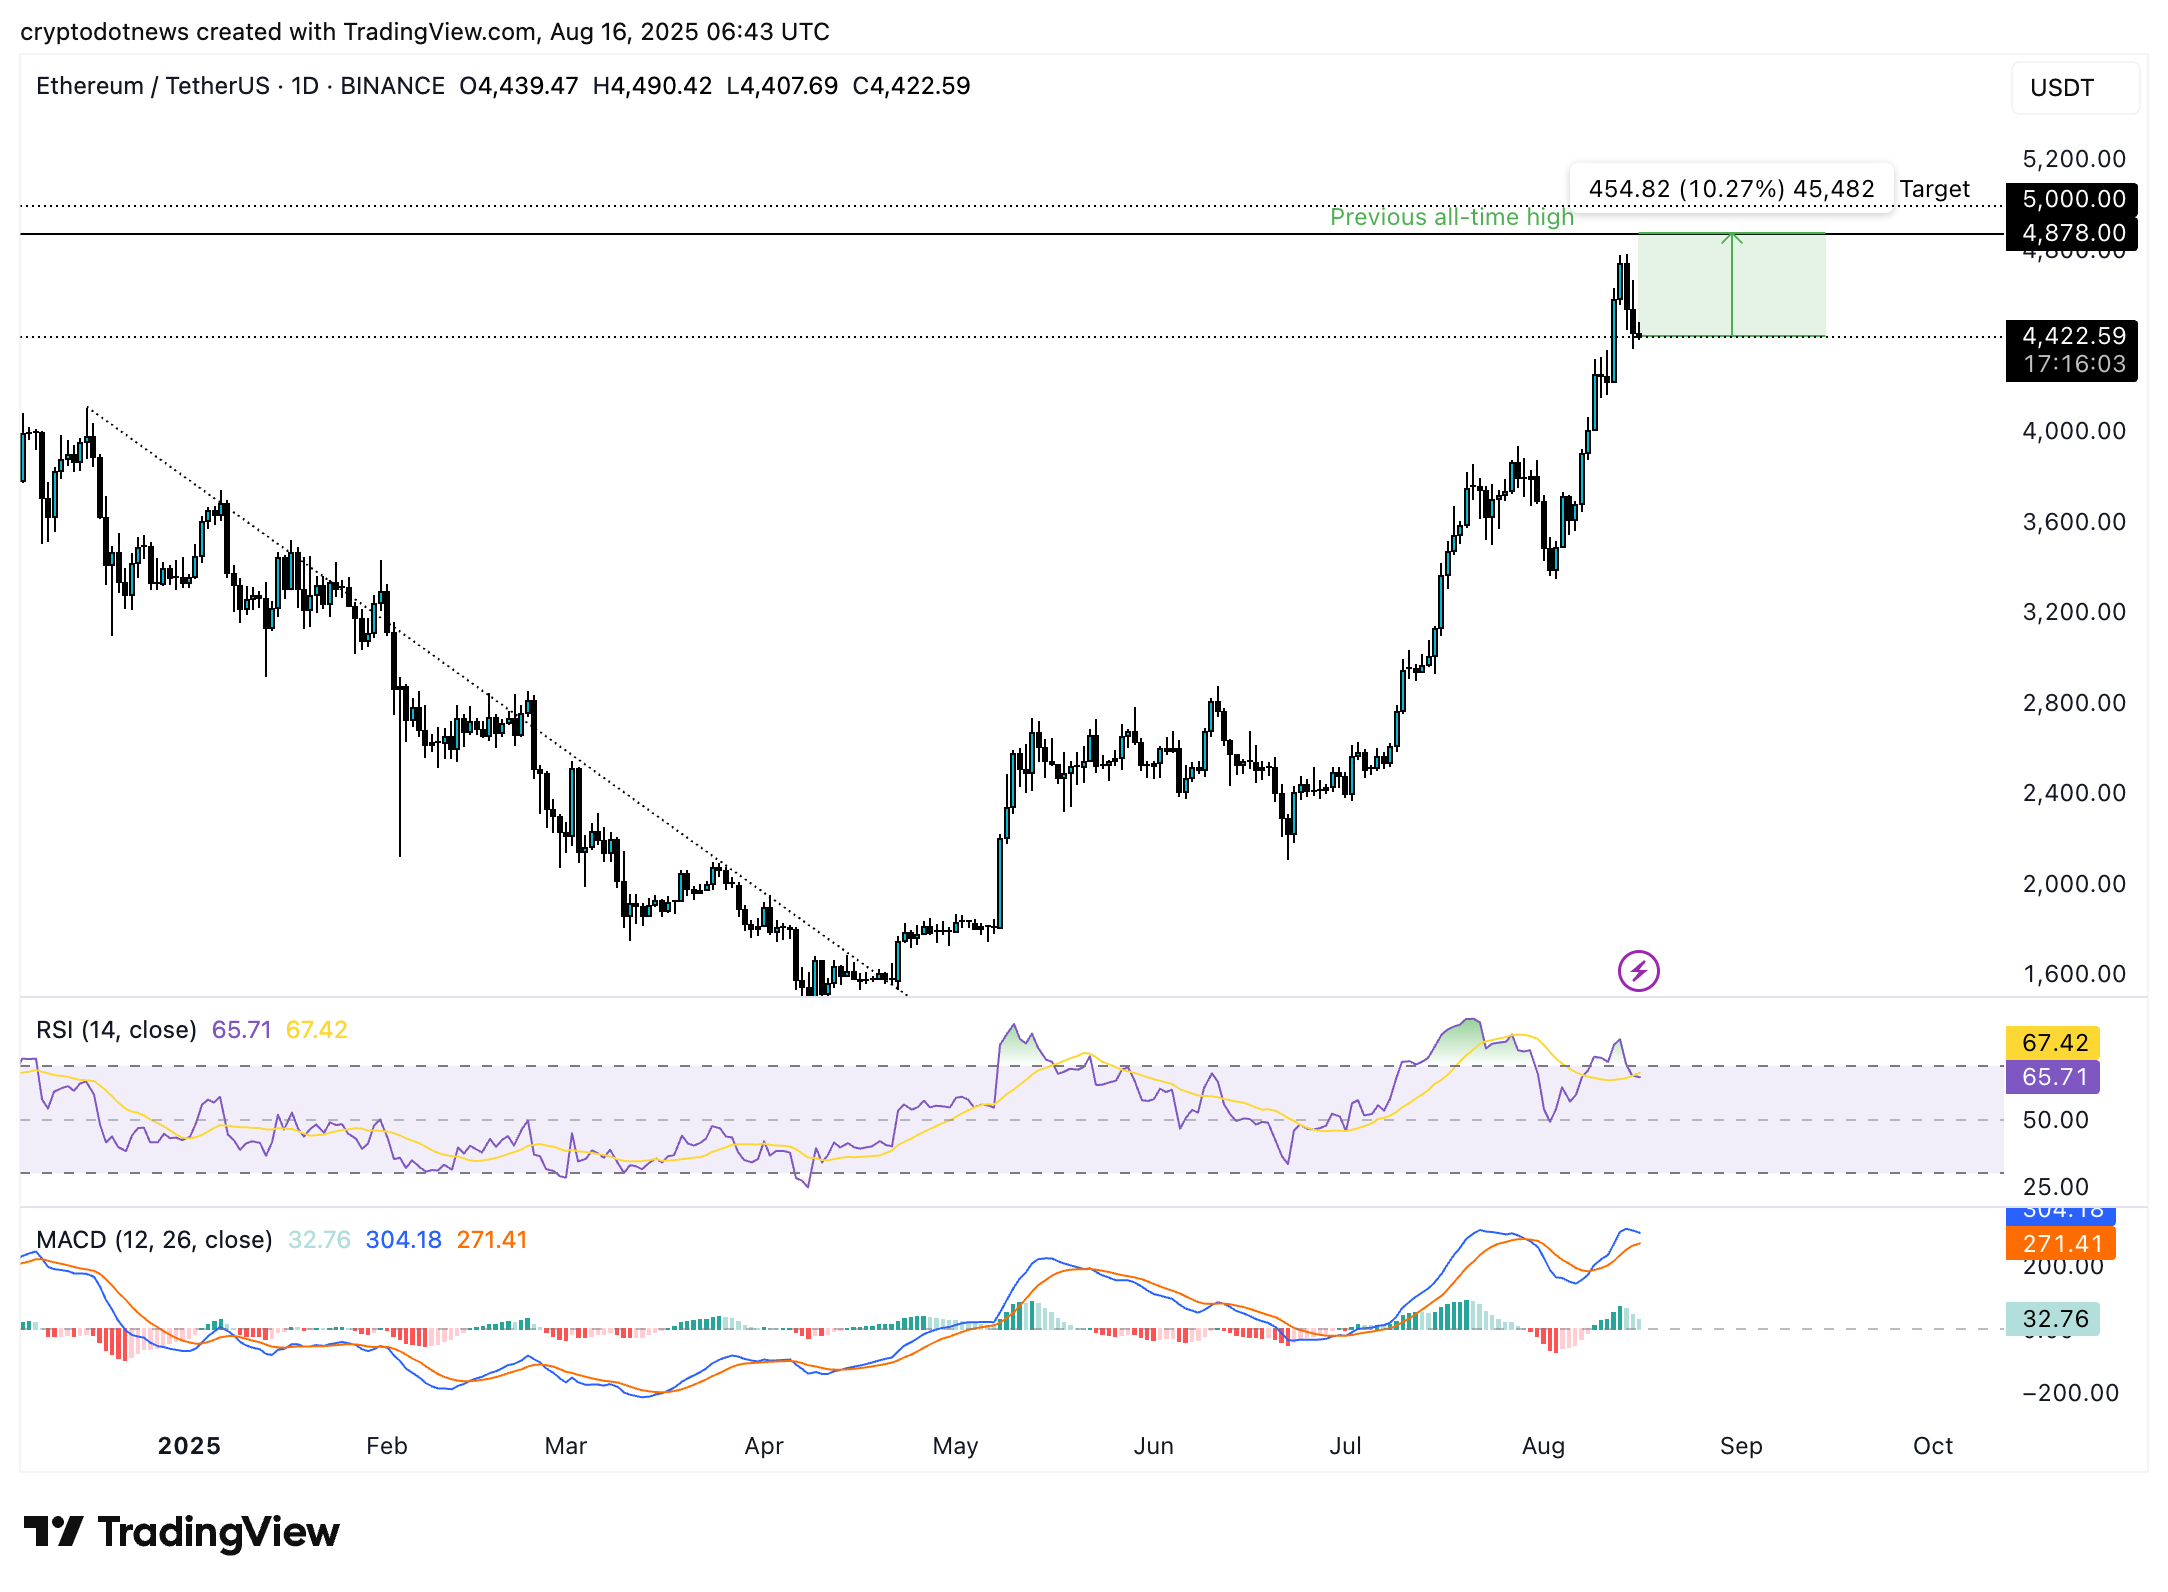
With Bitcoin’s new all-time high above $124,000, traders are speculating whether the cycle top is in and altcoin season is brewing. The largest altcoin, Ethereum, is climbing steadily towards its $5,000 target, supporting the thesis.
Bitcoin and Ethereum performance
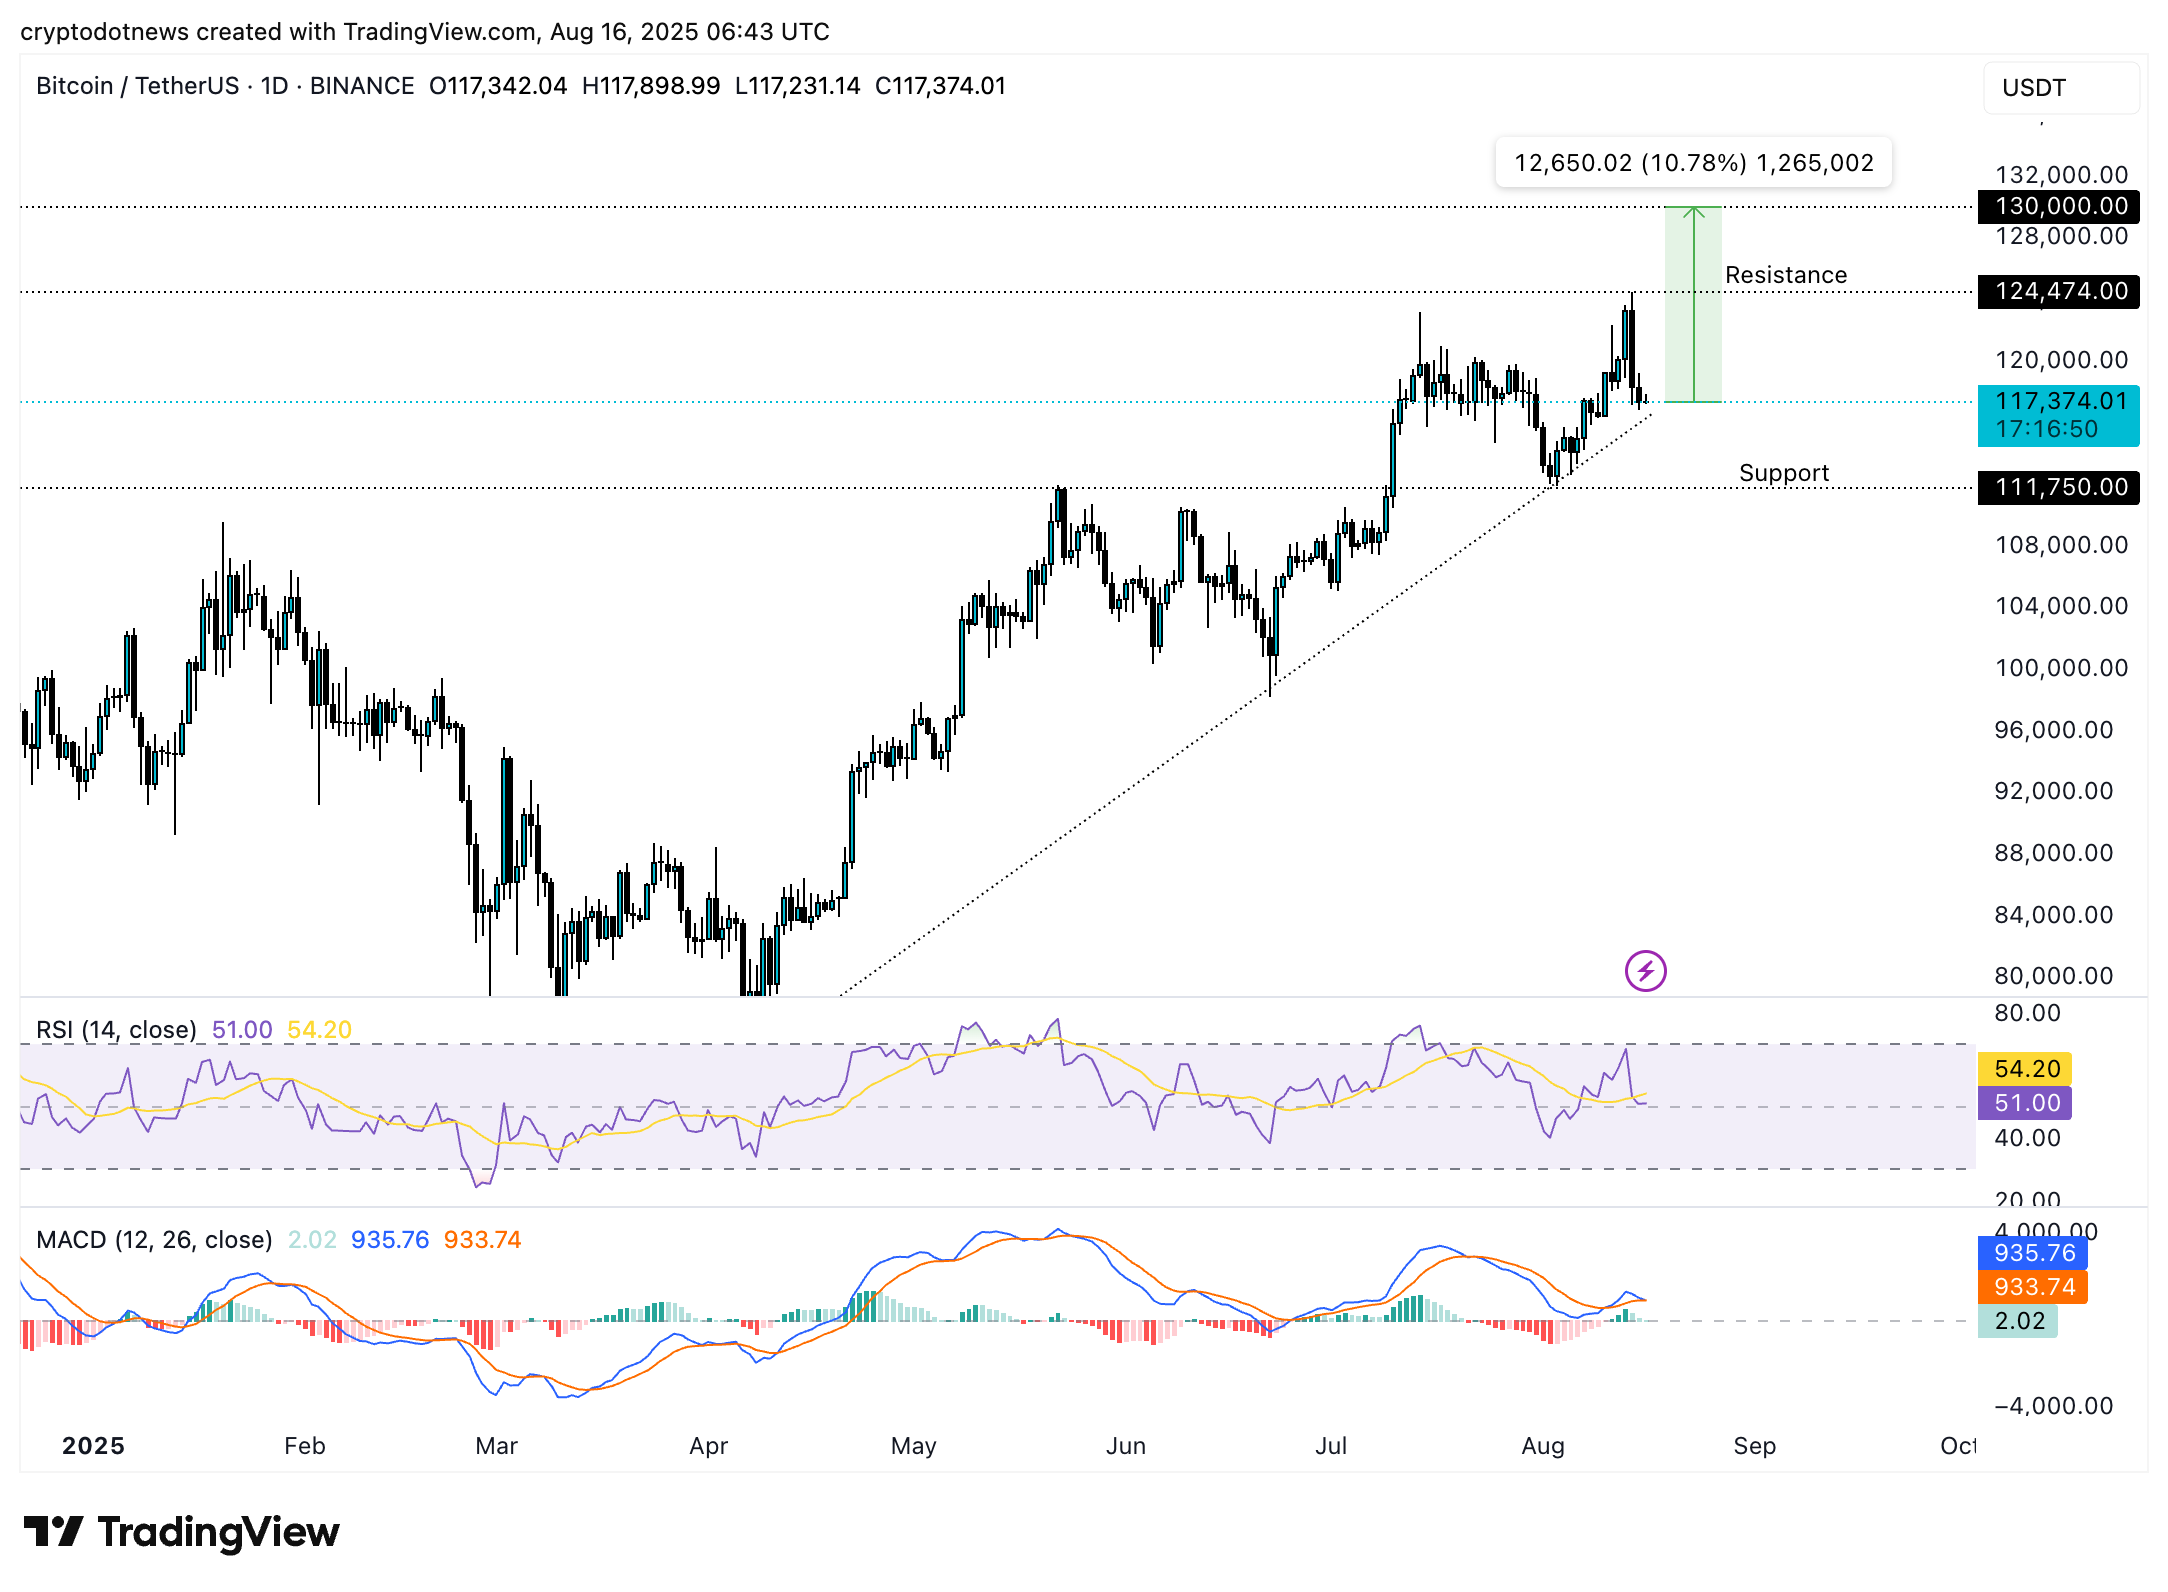
Bitcoin corrected to $117,374, losing its gains after hitting a new all-time high at $124,474. The $130,000 is the next target for BTC as it enters price discovery. At the time of writing, BTC is less than 11% away from its $130,000 target.
Bitcoin could find support at $111,750, a level where BTC can sweep liquidity prior to its next leg up.
RSI and MACD show mixed signals. RSI reads 51 and is sloping downwards. MACD flashes green histogram bars above the neutral level, supporting a bullish thesis for Bitcoin.
Ethereum is nearly 10% away from its previous all-time high. The largest altcoin faces sticky resistance at the $4,800 level, in its rally to the target. The $4,000 level is a psychologically important support level and a correction in Ethereum could send the altcoin to this level.
Disclosure: This article does not represent investment advice. The content and materials featured on this page are for educational purposes only.