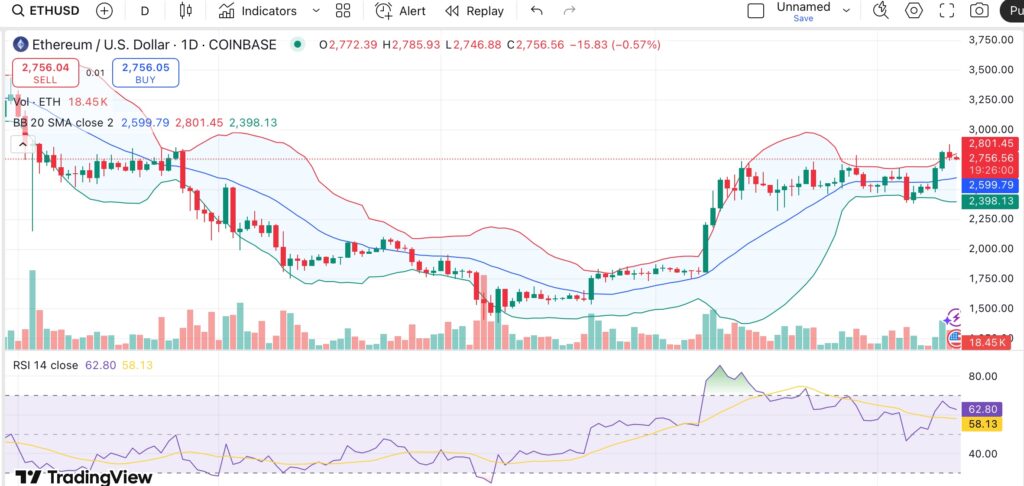
Ethereum is holding firm above the $2,700 mark, supported by a wave of fresh capital flowing into U.S. spot exchange-traded funds and growing optimism in the derivatives market.
Ethereum (ETH) is trading at about $2,756 at press time, down 1.2% in the past day but still up 13% for the month. The asset has fluctuated between a weekly range of $2,419 and $2,869, indicating a struggle between bulls and bears in the face of changing market conditions.
A major driver behind Ethereum’s resilience is the strength of spot ETF inflows. According to SoSoValue data, U.S. Ethereum ETFs saw net inflows of $240.7 million on June 11, the biggest one-day total in four months and the 18th day in a row of positive flows.
With $164.05 million, BlackRock’s ETHA led the inflows, followed by Fidelity’s FETH and Grayscale’s mini ETH offering. Cumulative inflows over the last 30 days have now reached $700 million, indicating sustained institutional interest through regulated investment vehicles.
At the same time, there is a noticeable shift in the options market toward a bullish outlook. Options are financial contracts that grant traders the right, but not the obligation, to buy or sell an asset at a predetermined price. Calls grant the right to purchase, while puts grant the right to sell. When more traders buy short-term call options, it typically reflects bets on upward price movement.
The ETH options skew, which measures the difference in demand between puts and calls, moved sharply more negative between June 9 and 10, according to data shared by Glassnode on June 11. The 1-week skew dropped from -2.4% to -7.0%, and the 1-month skew shifted from -5.6% to -6.1%, reflecting rising demand for calls over puts. Short-term price rallies often precede such a shift.
https://twitter.com/glassnode/status/1932787400893178252?s=46&t=nznXkss3debX8JIhNzHmzw
Looking at the technical picture, Ethereum is still in a bullish structure. At 63, the relative strength index is approaching overbought but is still in neutral territory. ETH continues to trade above its 10-day estimated moving average at $2,658, as well as its 50- and 200-day moving averages, all of which indicate sustained buying strength.
Bollinger Bands have recently widened, with the price holding onto the upper band, which is often a sign that volatility may continue. ETH has continuously printed higher highs and higher lows since the beginning of May, supporting the upward trend.

Ethereum might retest $2,900 and aim for a breakout above $3,000 if ETF inflows continue to be strong and options bullishness increases. However, a drop below $2,700, especially if inflows slow, could bring a pullback toward the $2,600 level or even test support near $2,400.


