Solana price has pulled back after soaring to $295 in January as its ecosystem and the broader crypto industry lost momentum.
Solana (SOL) dropped to the psychological level of $200, marking a 35% decline from its highest point this year.
This retreat is largely due to Bitcoin (BTC) and other altcoins pulling back. Bitcoin has fallen from this year’s high of $109,200 to below $99,000, weighing on tokens in the Solana ecosystem.
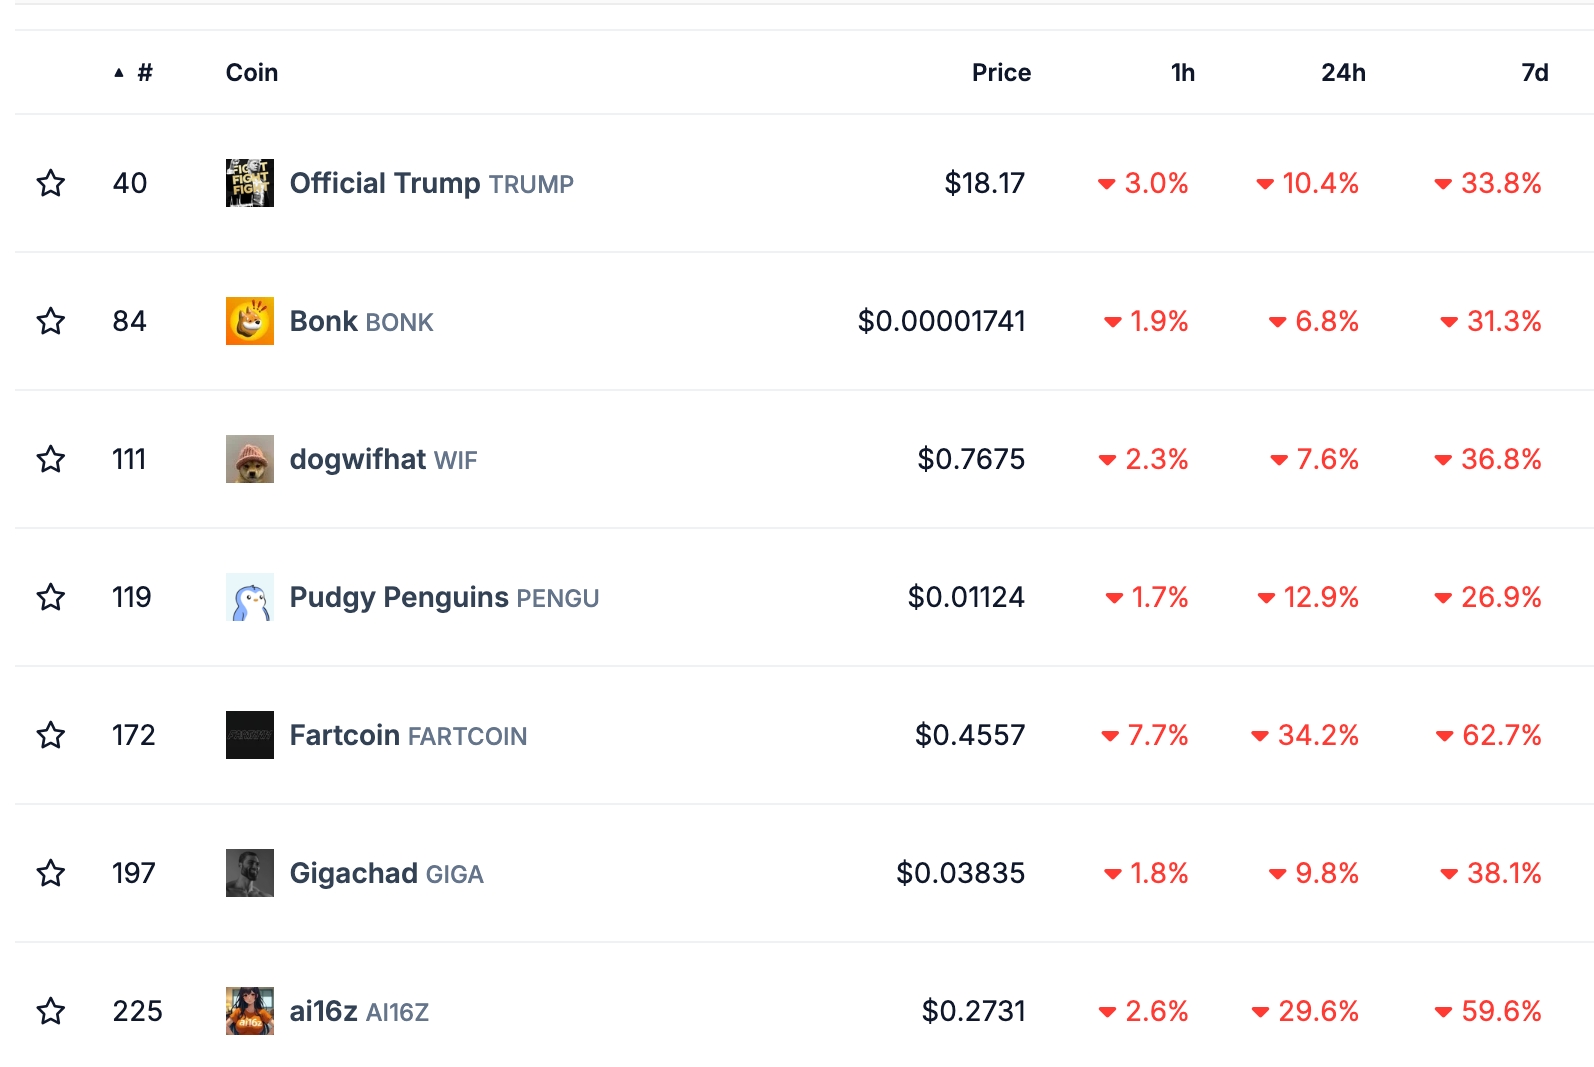
According to CoinGecko, the total market cap of all Solana meme coins has declined from over $25 billion in January to $12 billion. Most of these tokens, including Bonk, Dogwifhat, Pudgy Penguins, and Fartcoin, have dropped by more than 30% in the last 30 days.

Further data shows that Solana’s decentralized exchange trading volume has fallen in recent days as investors exit meme coins. Trading volume has dropped by 25% in the past seven days to $41.6 billion. Raydium, Meteora, and Lifinity saw their weekly volume decline by over 30% in the same period.
Solana’s non-fungible token sales have also dropped in the last 30 days. According to CryptoSlam, these sales fell by 36% in the last 30 days to $75 million.
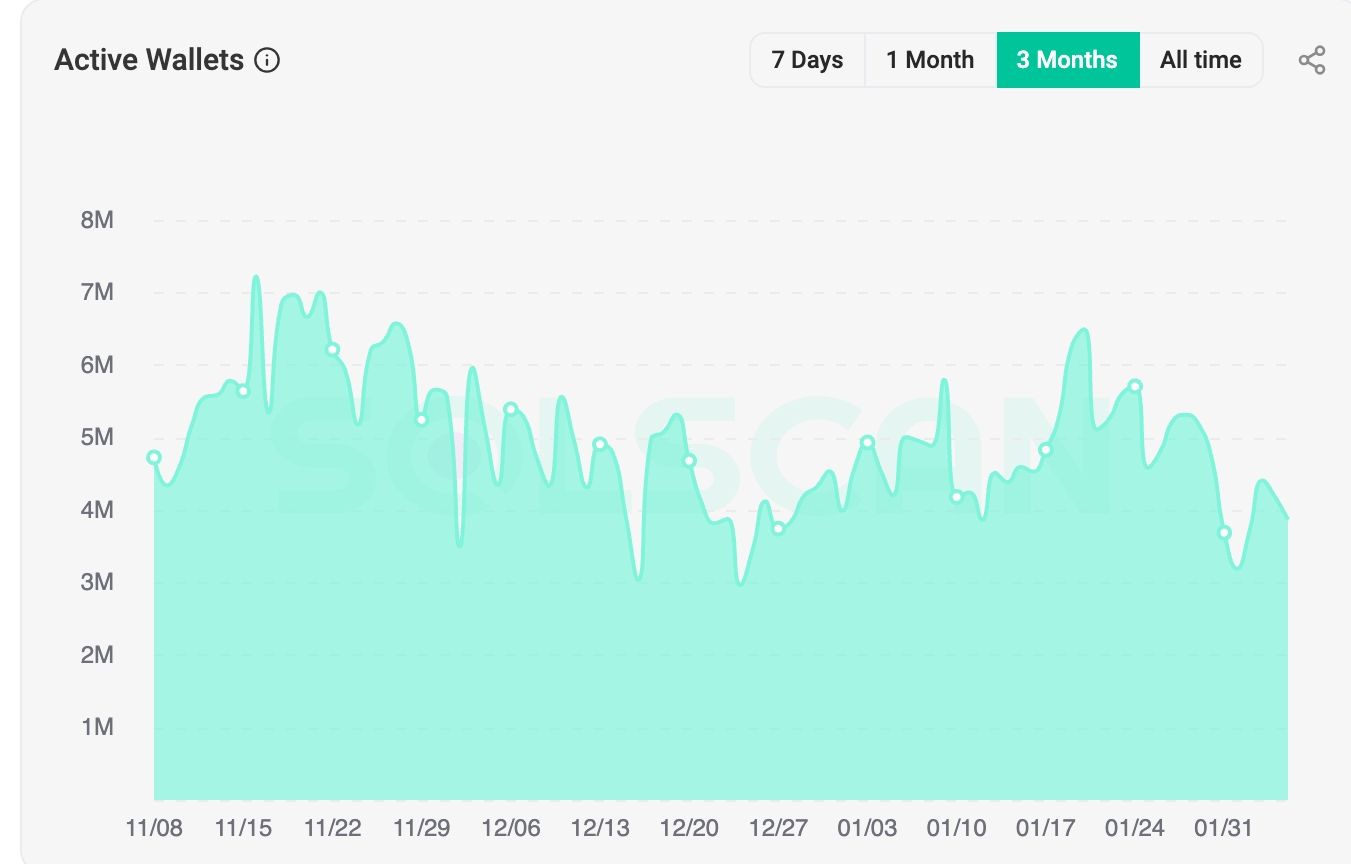
More data also shows hat the number of active wallets in the network has dropped to 3.8 million, down from 6.5 million in January.

Solana price prediction

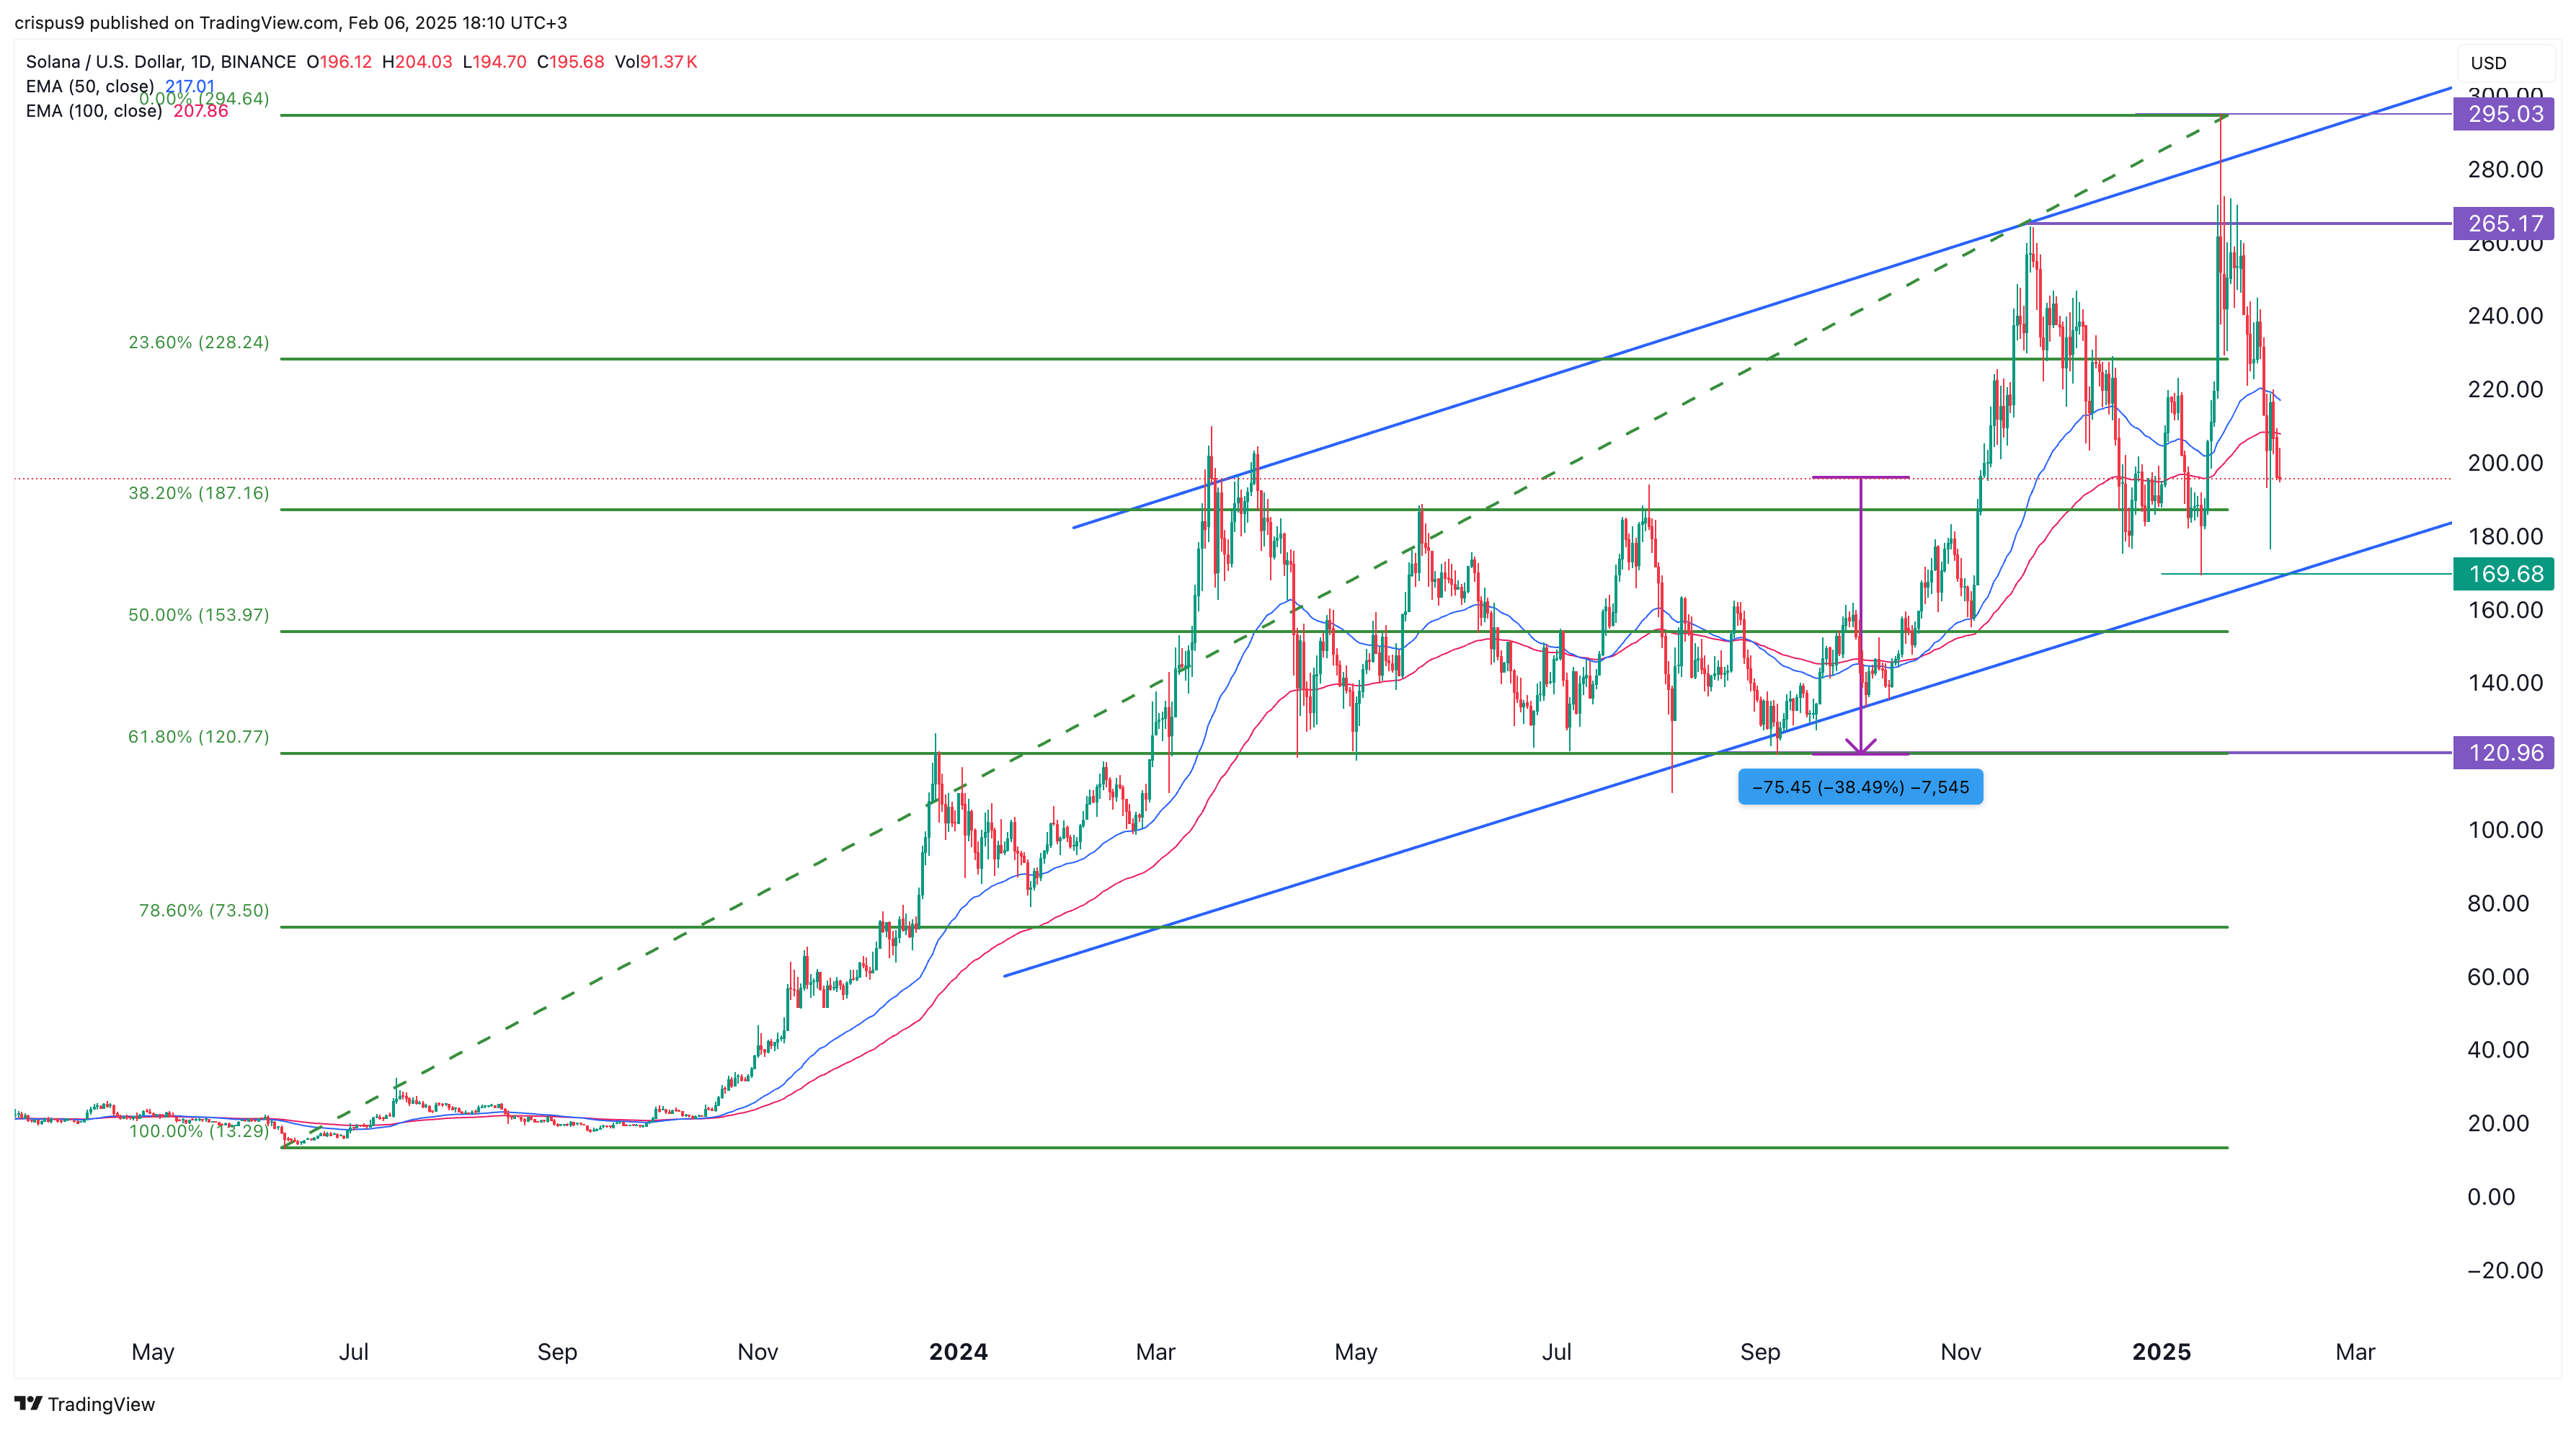
The daily chart shows that the SOL price peaked at $295.05 in January and has moved into a technical bear market, falling by about 35%. Solana has also moved below the 50-day and 25-day Exponential Moving Averages.
It has moved below the 25-day and 50-day Exponential Moving Averages, a sign that bears are gaining control. SOL also moved below the 23.6% Fibonacci Retracement level. Notably, the coin has formed a double-top pattern at $265, and whose neckline is at $170.
A double-top is a widely recognized bearish reversal pattern in technical analysis. A drop below the neckline and the lower boundary of the ascending channel would confirm further downside, potentially pushing the price to the 61.8% retracement level at $120, representing a 40% decline from current levels.


