Bitcoin is back above $96,000, recovering from its December 31 drop to support at $92,000. Crypto markets are recovering from a correction and altcoins have started their recovery, as anticipation for pro-crypto regulation and policy in the U.S. brews in 2025.
President-elect Donald Trump’s inauguration is less than three weeks away and this could influence crypto markets and altcoin prices. Top three tokens where price swings and changes are expected to occur are Bitcoin (BTC), Solana (SOL) and Ripple (XRP).
On-chain metrics support gains in Bitcoin, XRP and Solana
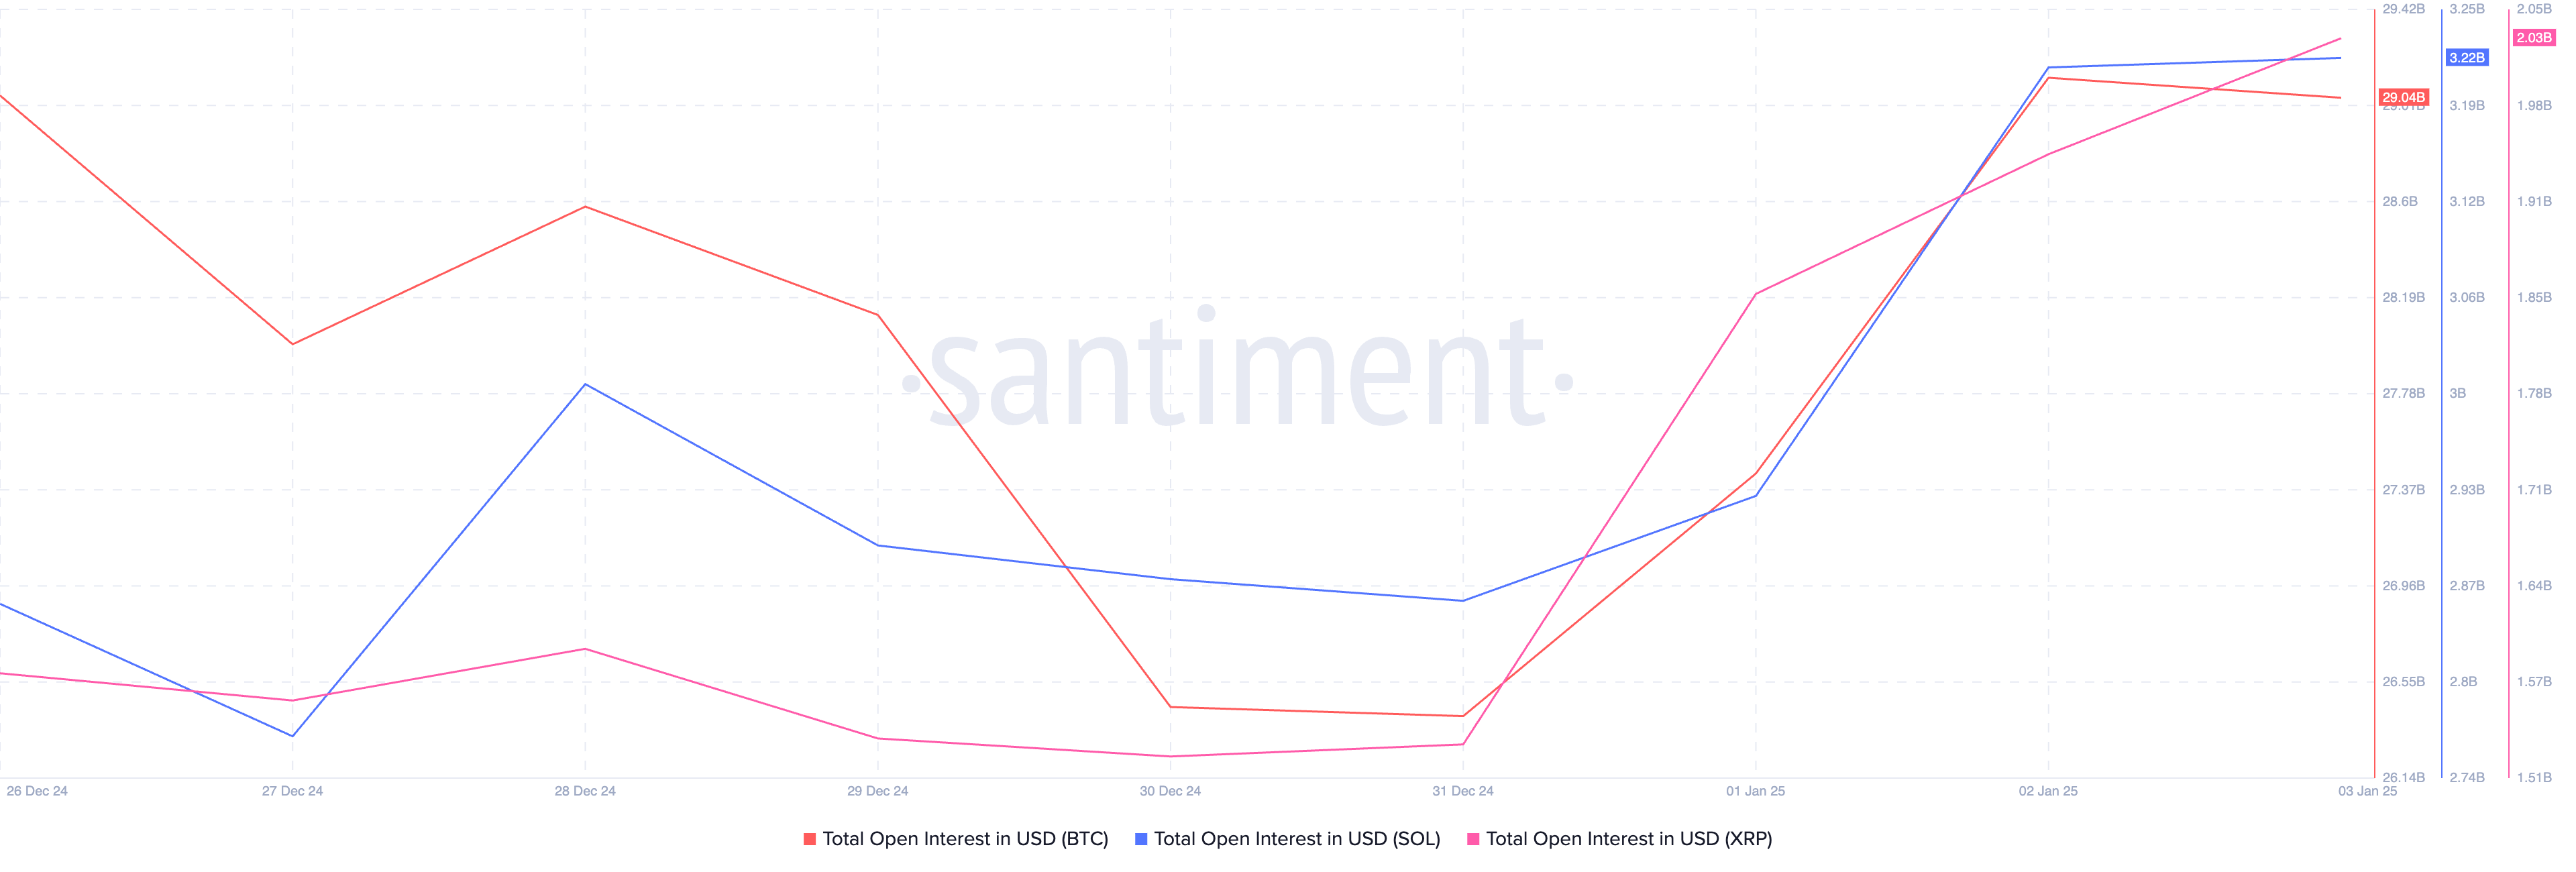
Open interest is typically considered an indicator of interest and demand for a crypto token among traders. Data from Santiment shows that there is an increase in OI in Bitcoin, XRP and Solana since the December 31 low.
Derivatives traders’ appetite for the three tokens has increased within the first three days of January, supporting a bullish thesis.
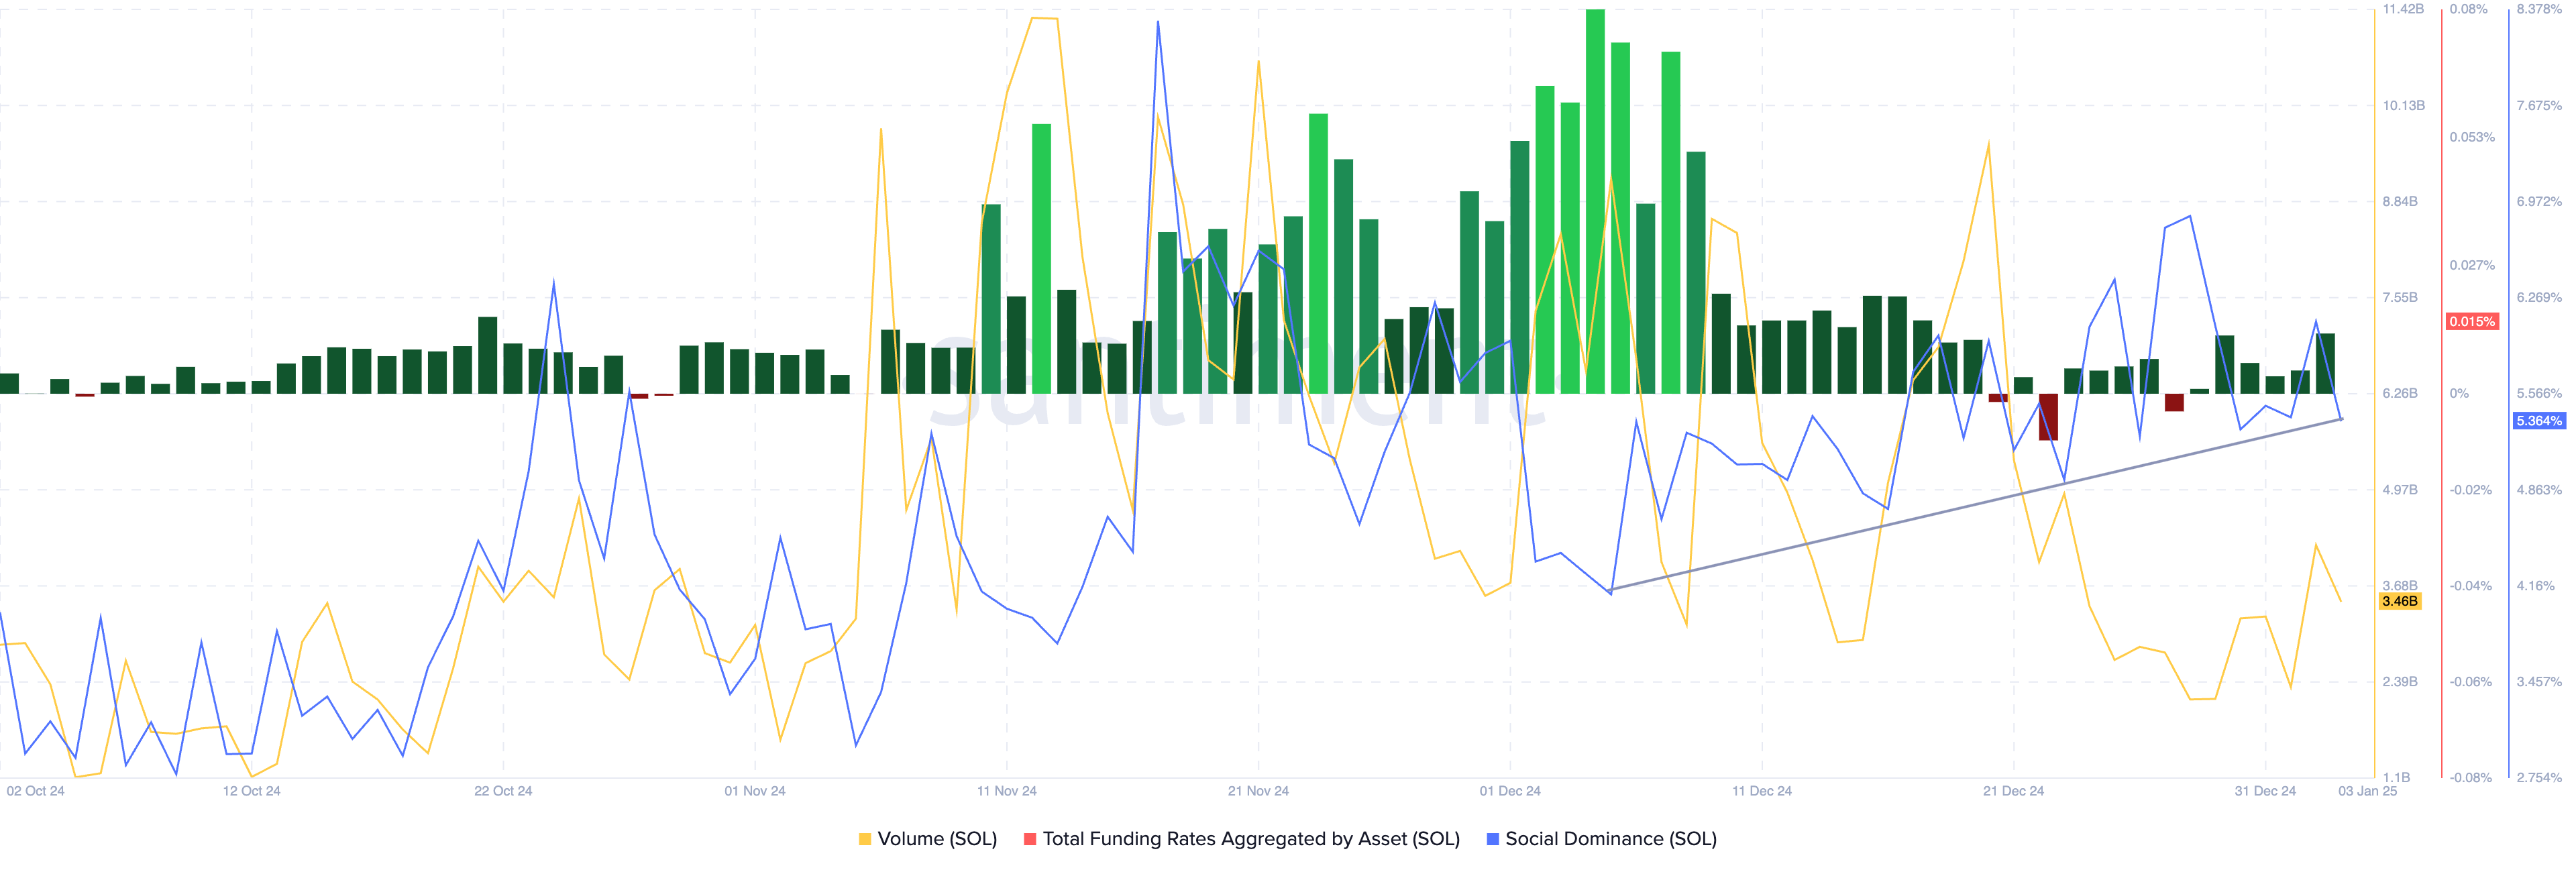
Solana’s social dominance is in an upward trend. The token is recording increasing mentions across social media platforms like X and a steady rise in volume of SOL traded on exchanges. The Santiment chart below shows the funding rate aggregated across derivatives exchanges is positive for the last five days, meaning there is optimism among traders.
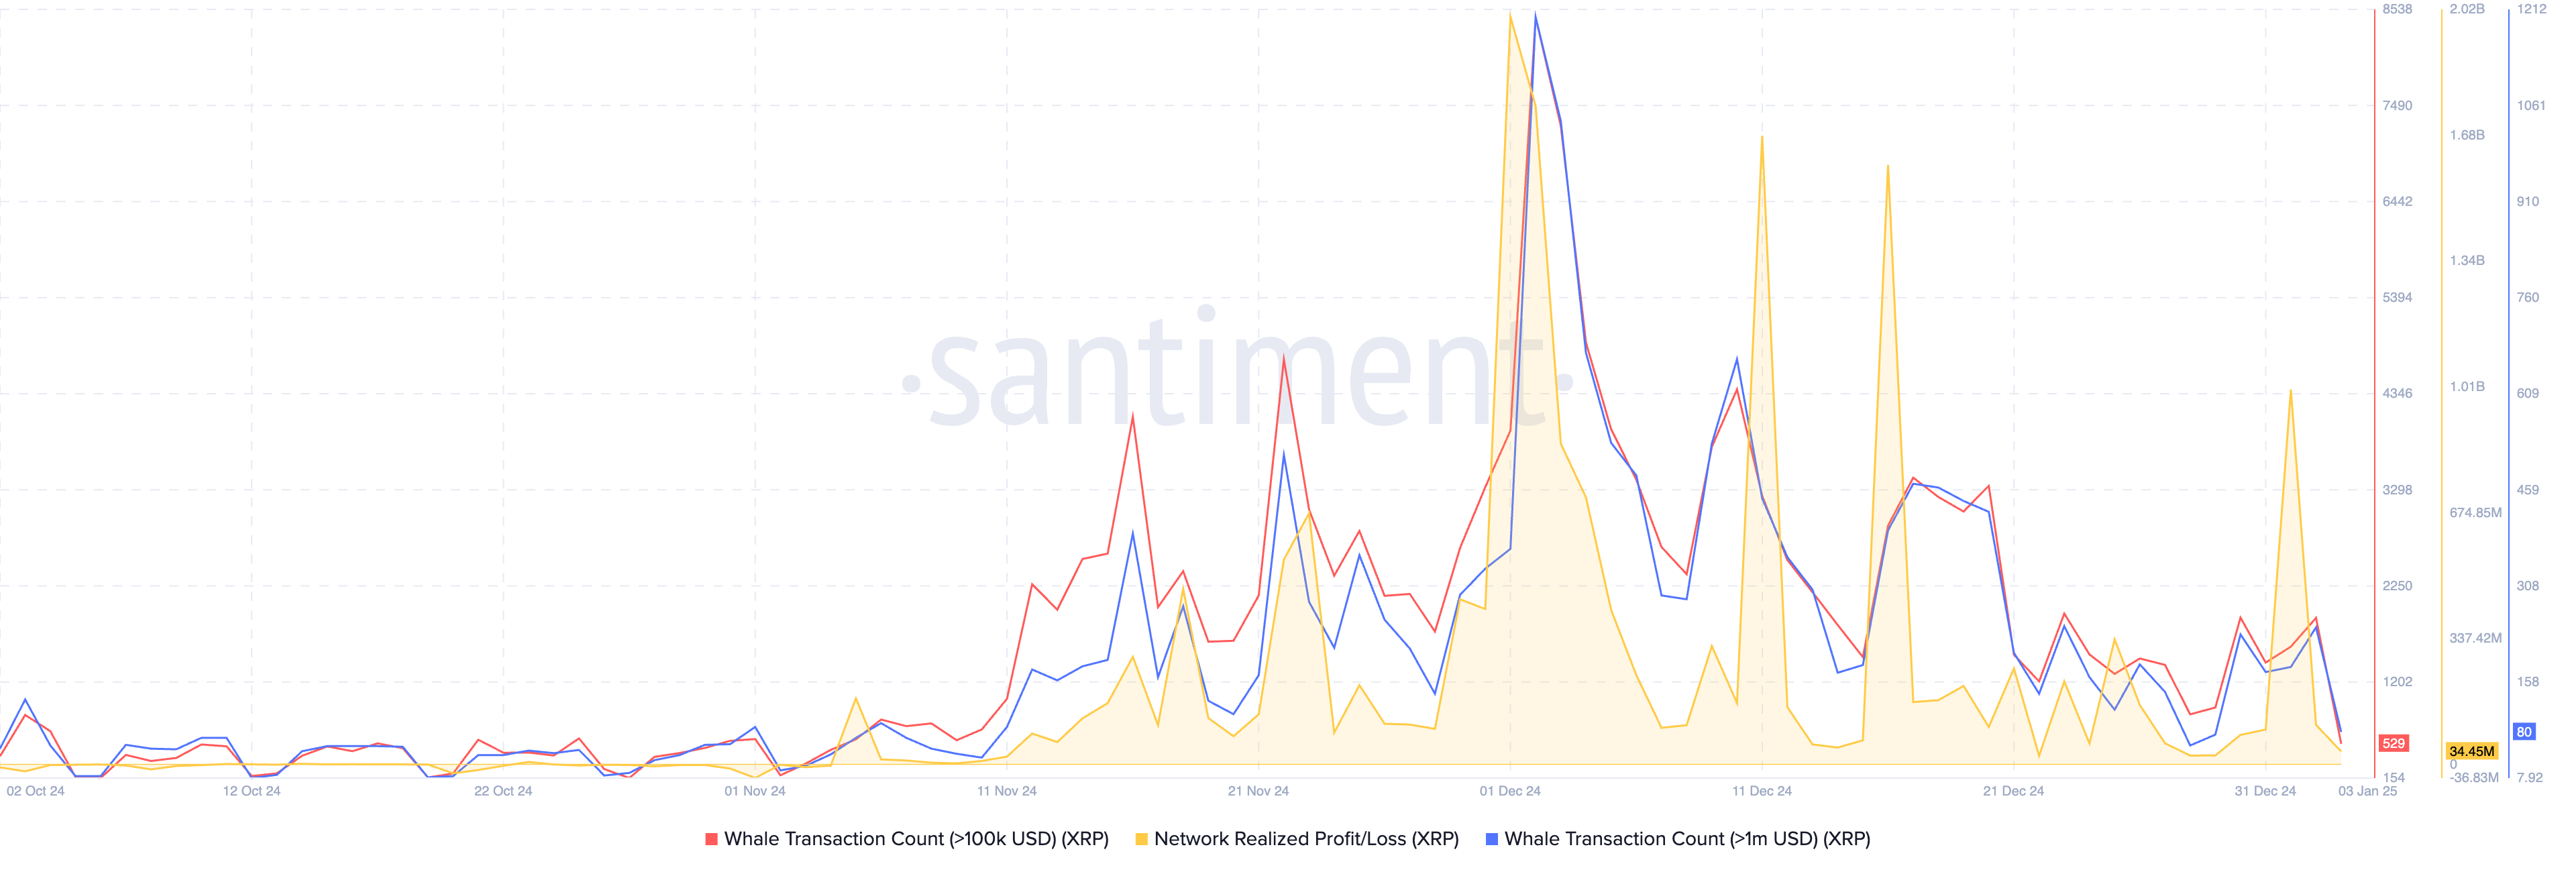
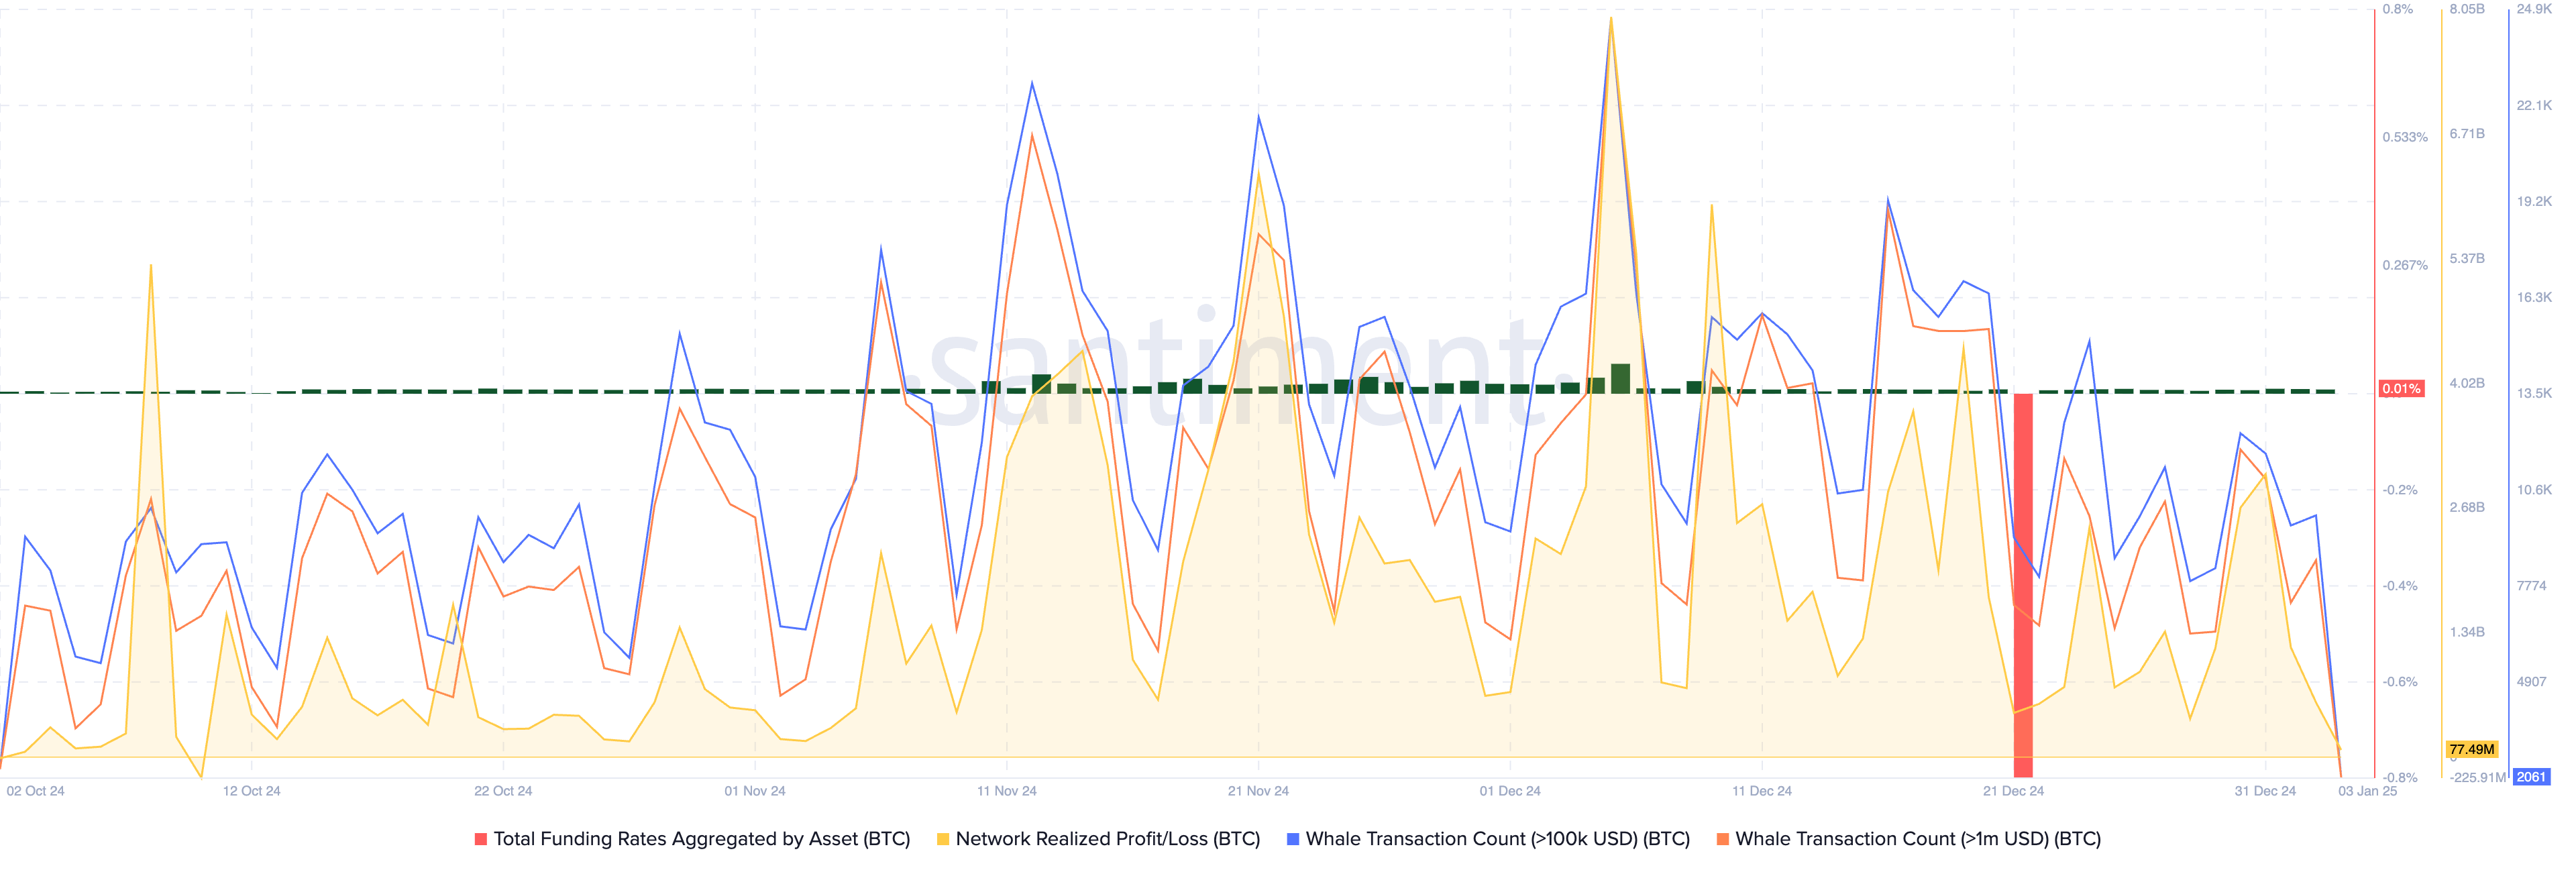
XRP has observed a decline in the count of large volume transactions, valued at $100,000 and $1,000,000 since December 31. Typically, this would be considered a negative sign as it shows whales or large wallet holders of the token are losing interest, however this could reduce or end the profit-taking streak in XRP.
The Network realized profit/loss metric measures the net profit/loss realized by all traders who moved tokens on a given day. The NPL metric shows consistent profit-taking since the first-week of November. The nearly two month long streak could end as whales slow down and reduce their activity in XRP.
Bitcoin’s funding rate has been positive for the last ten days of December and the first three days of January 2025. With derivatives traders maintaining an optimistic outlook, whale transactions have taken a hit, profit-taking activities of traders could reduce, similar to XRP.
MicroStrategy’s declining NAV is not Bitcoin’s only concern
Institutional capital inflow to Bitcoin is in a state of decline. Data from Farside investors shows net flows to U.S. based spot BTC ETFs has suffered since the last week of December 2024.
On Thursday, January 2, ETFs recorded a net outflow of $247.80 million.
With institutional investment acting as one of the biggest catalysts for Bitcoin price rally in 2024, it remains to be seen how the reduced inflows affect the token in 2025.

MicroStrategy, one of the largest public holders of Bitcoin has recorded nearly 44% decline in its shares, from their peak. Following in Michael Saylor-led business intelligence firm’s footsteps, many corporates have adopted Bitcoin as a treasury asset, at a smaller scale. However, the demand generated by this narrative is waning.
The holiday day, combined with the shifting U.S. macroeconomic environment, reducing trade volumes and stablecoin issuance have negatively influenced BTC price. The token holds steady above $96,000 and it remains to be seen how much longer it takes for Bitcoin to retest its $100,000 milestone and its new all-time high above $108,000.
Solana and XRP face hurdles amidst hopes of ETF approval
Solana’s meme coin narrative that fueled gains in the token and positioned it as a competitor to the largest altcoin, Ethereum (ETH), is slowly losing steam. With a decline in airdrops and reduced network activity, Solana has observed reduced on-chain activity on its chain.
Solana’s stablecoin market capitalization is another metric that continues to lag behind Ethereum, even as its decentralized exchange metrics like volume and protocol revenue outperform Ether.
The Securities & Exchange Commission’s appeal in the Ripple lawsuit lingers, amidst anticipation of the changing tide of crypto regulation and policy in the U.S. Traders remain hopeful that a new SEC Chair could remedy the situation and likely end the years-long legal battle that dragged down XRP between 2020 and 2024.
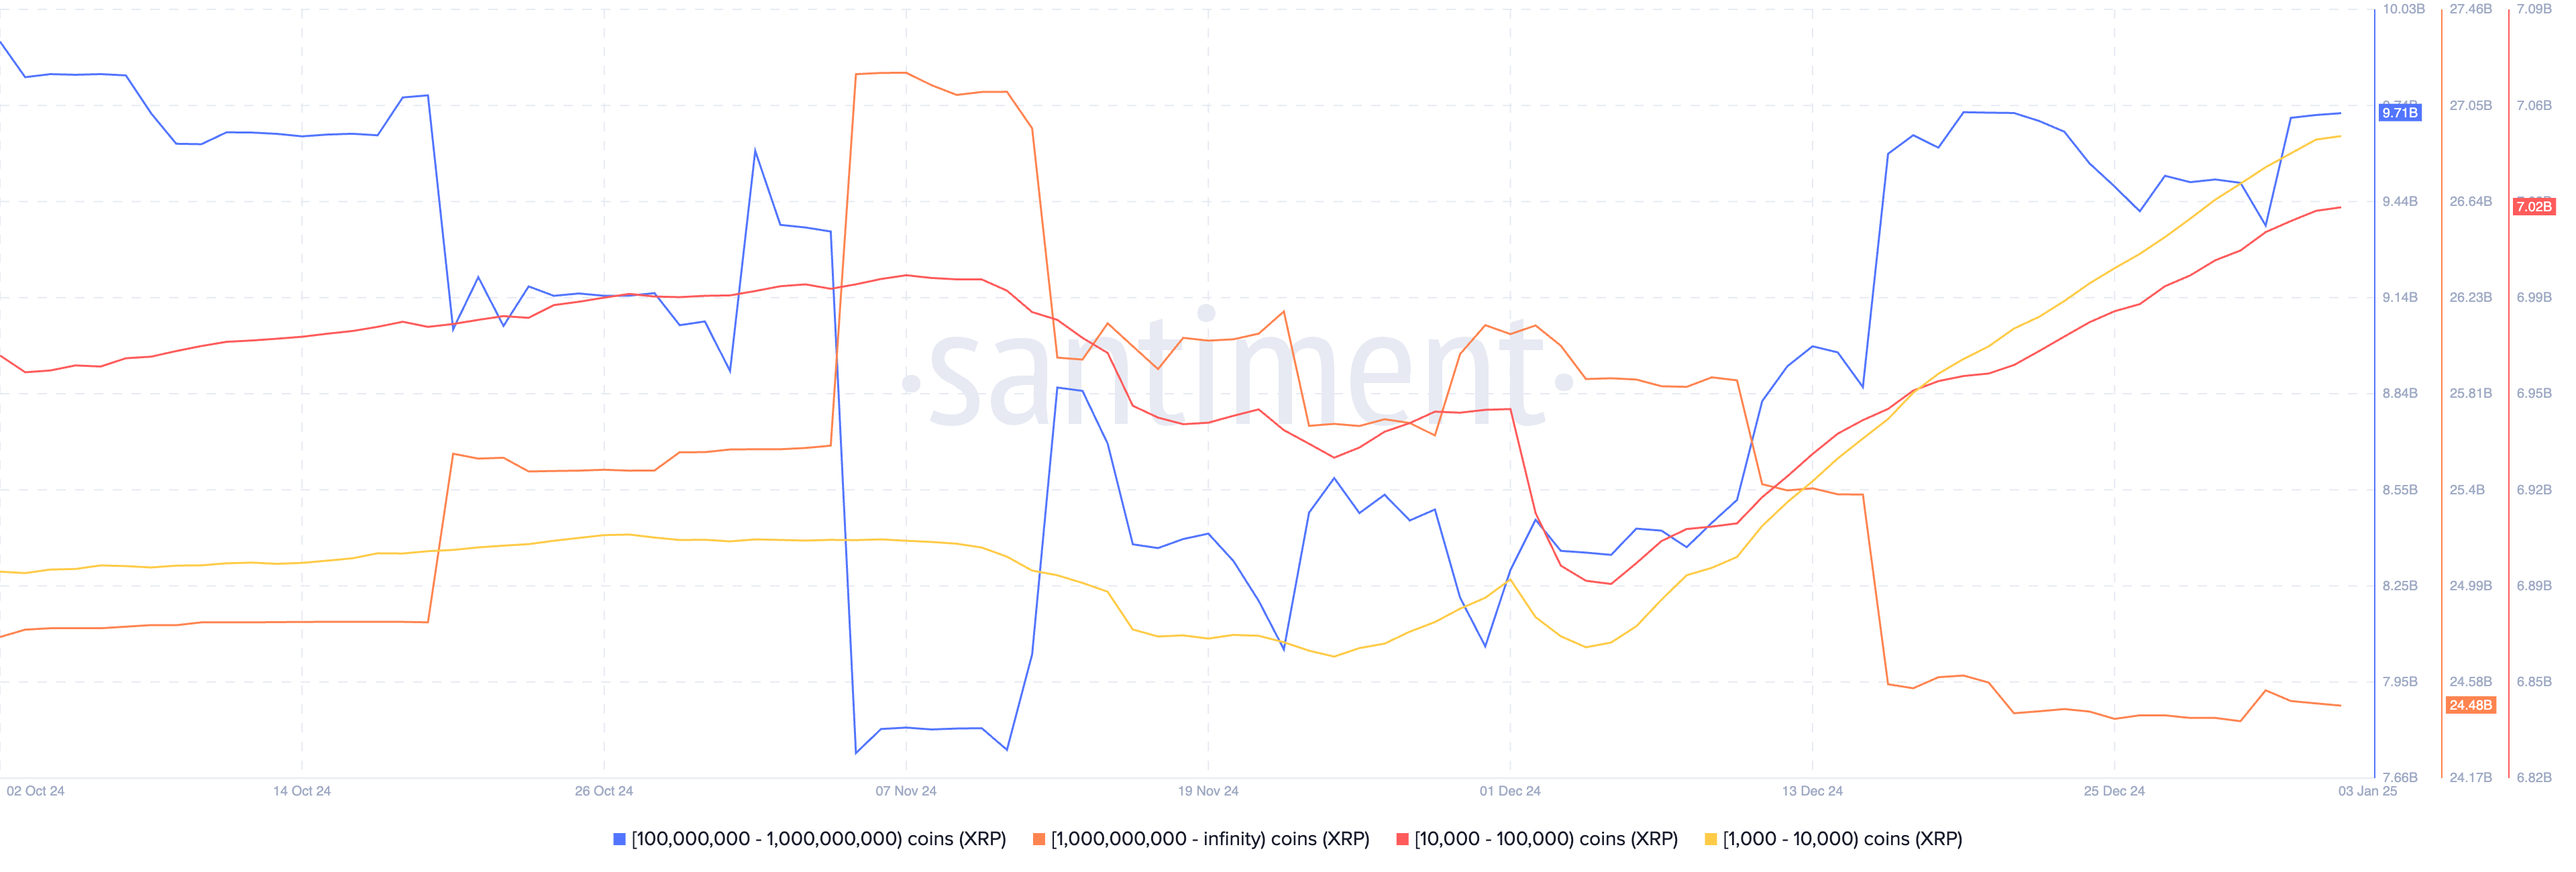
The anticipation has large wallet investors holding between 100 million and 1 billion XRP tokens, adding over 350 million XRP to their holdings within the first three days of January. Santiment data shows the accumulation and supports a bullish thesis for the altcoin.
Technical analysis and targets
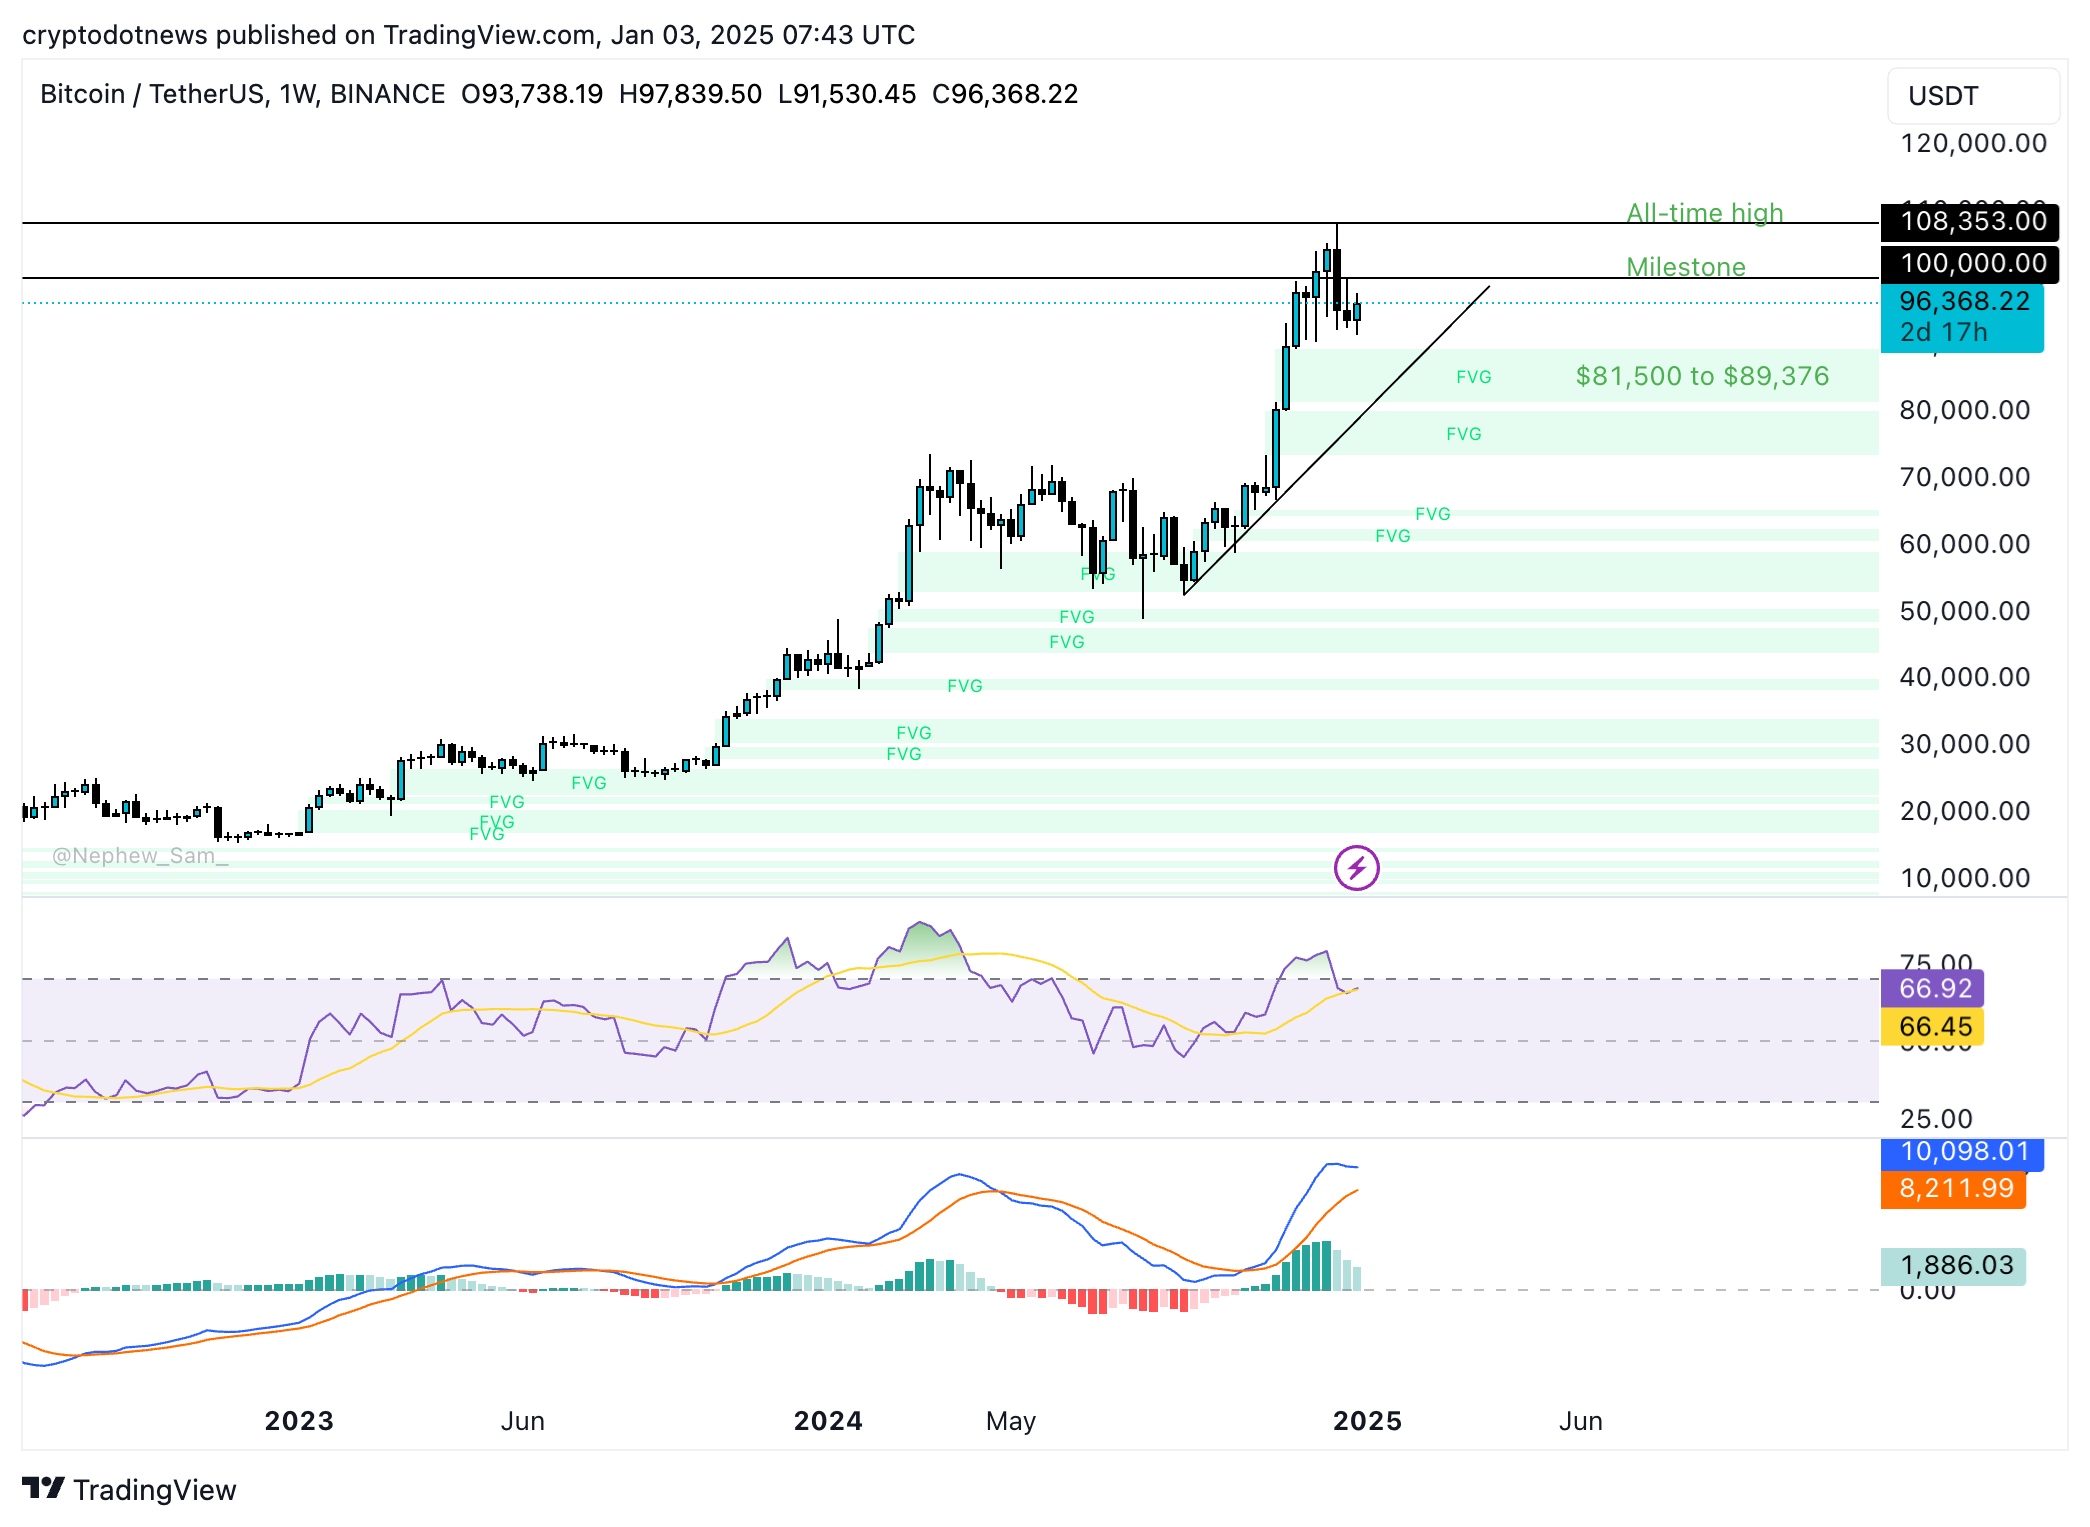
Bitcoin weekly price chart shows BTC is in an upward trend. Technical indicators support gains in BTC. Moving average convergence divergence flashes green histogram bars above the neutral line, meaning that there is underlying positive momentum in the Bitcoin price trend, and the RSI reads 66 and is sloping upwards.
BTC could find support in the Fair value gap between $81,500 and $89,376 if there is a correction in the largest cryptocurrency. BTC/USDT weekly price chart shows the token could test its $100,000 milestone and revisit its all-time high if the upward trend is sustained.
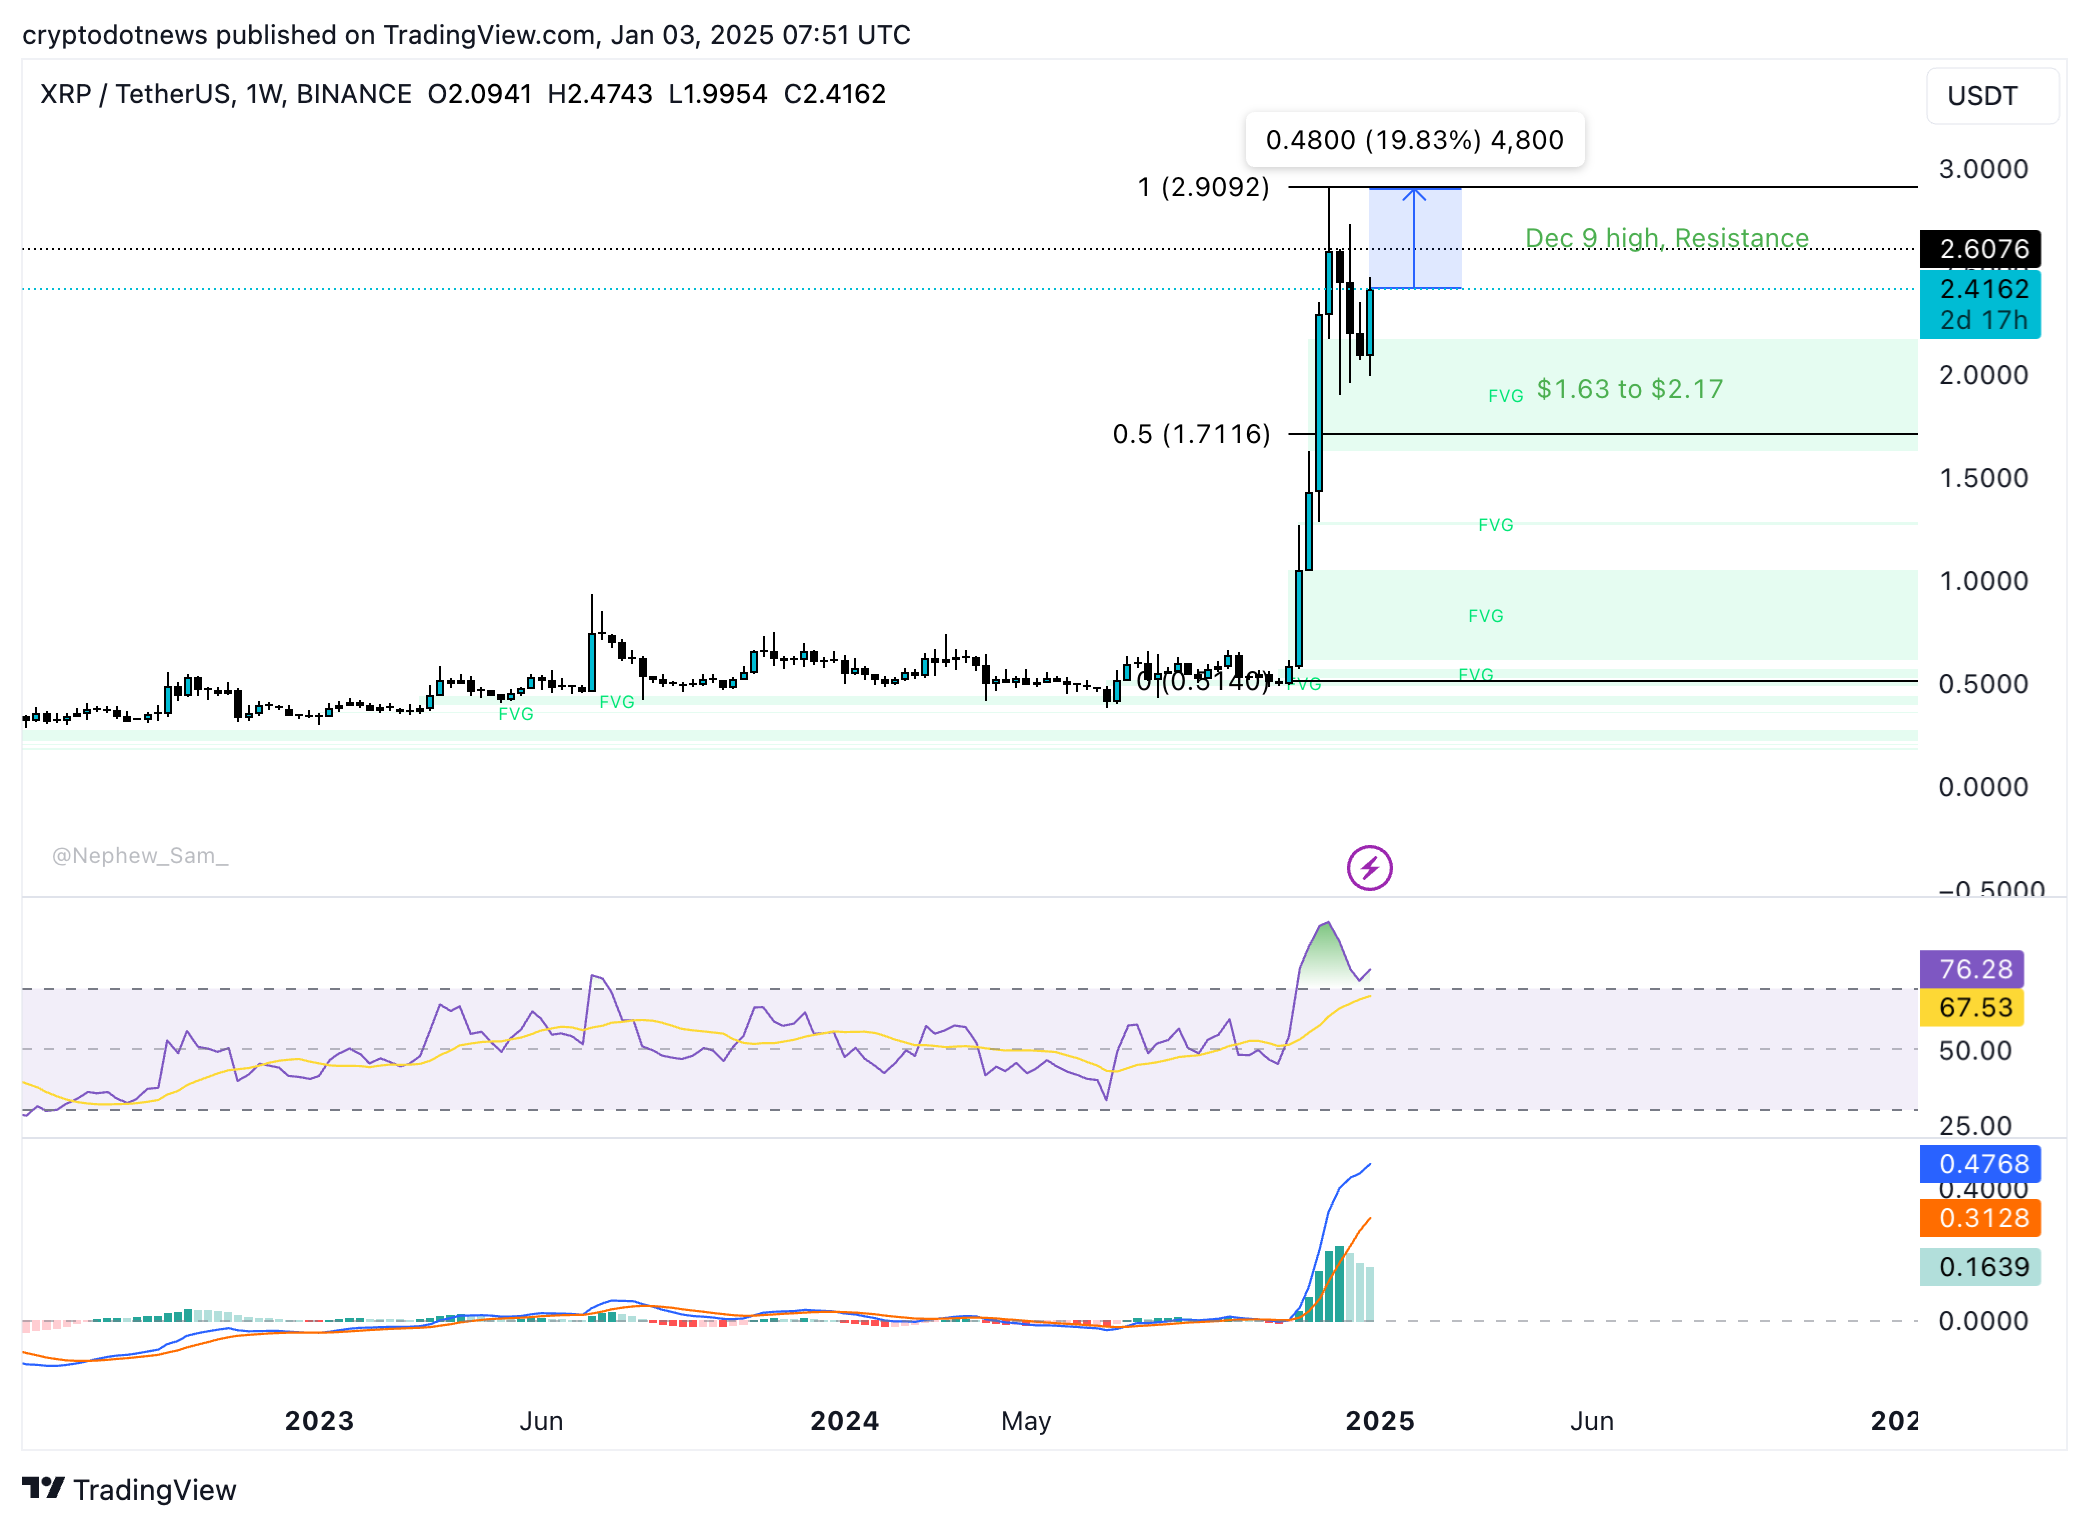
XRP is currently nearly 20% away from its peak of $2.9092, recorded in 2024. The altcoin faces resistance at the December 9 high of $2.6076, as seen on the XRP/USDT weekly price chart. The imbalance zone between $1.63 and $2.17 could act as support for XRP if there is a correction in XRP price.
RSI currently indicates that the altcoin is overvalued. However, MACD indicates there is an underlying positive momentum in the XRP price trend.
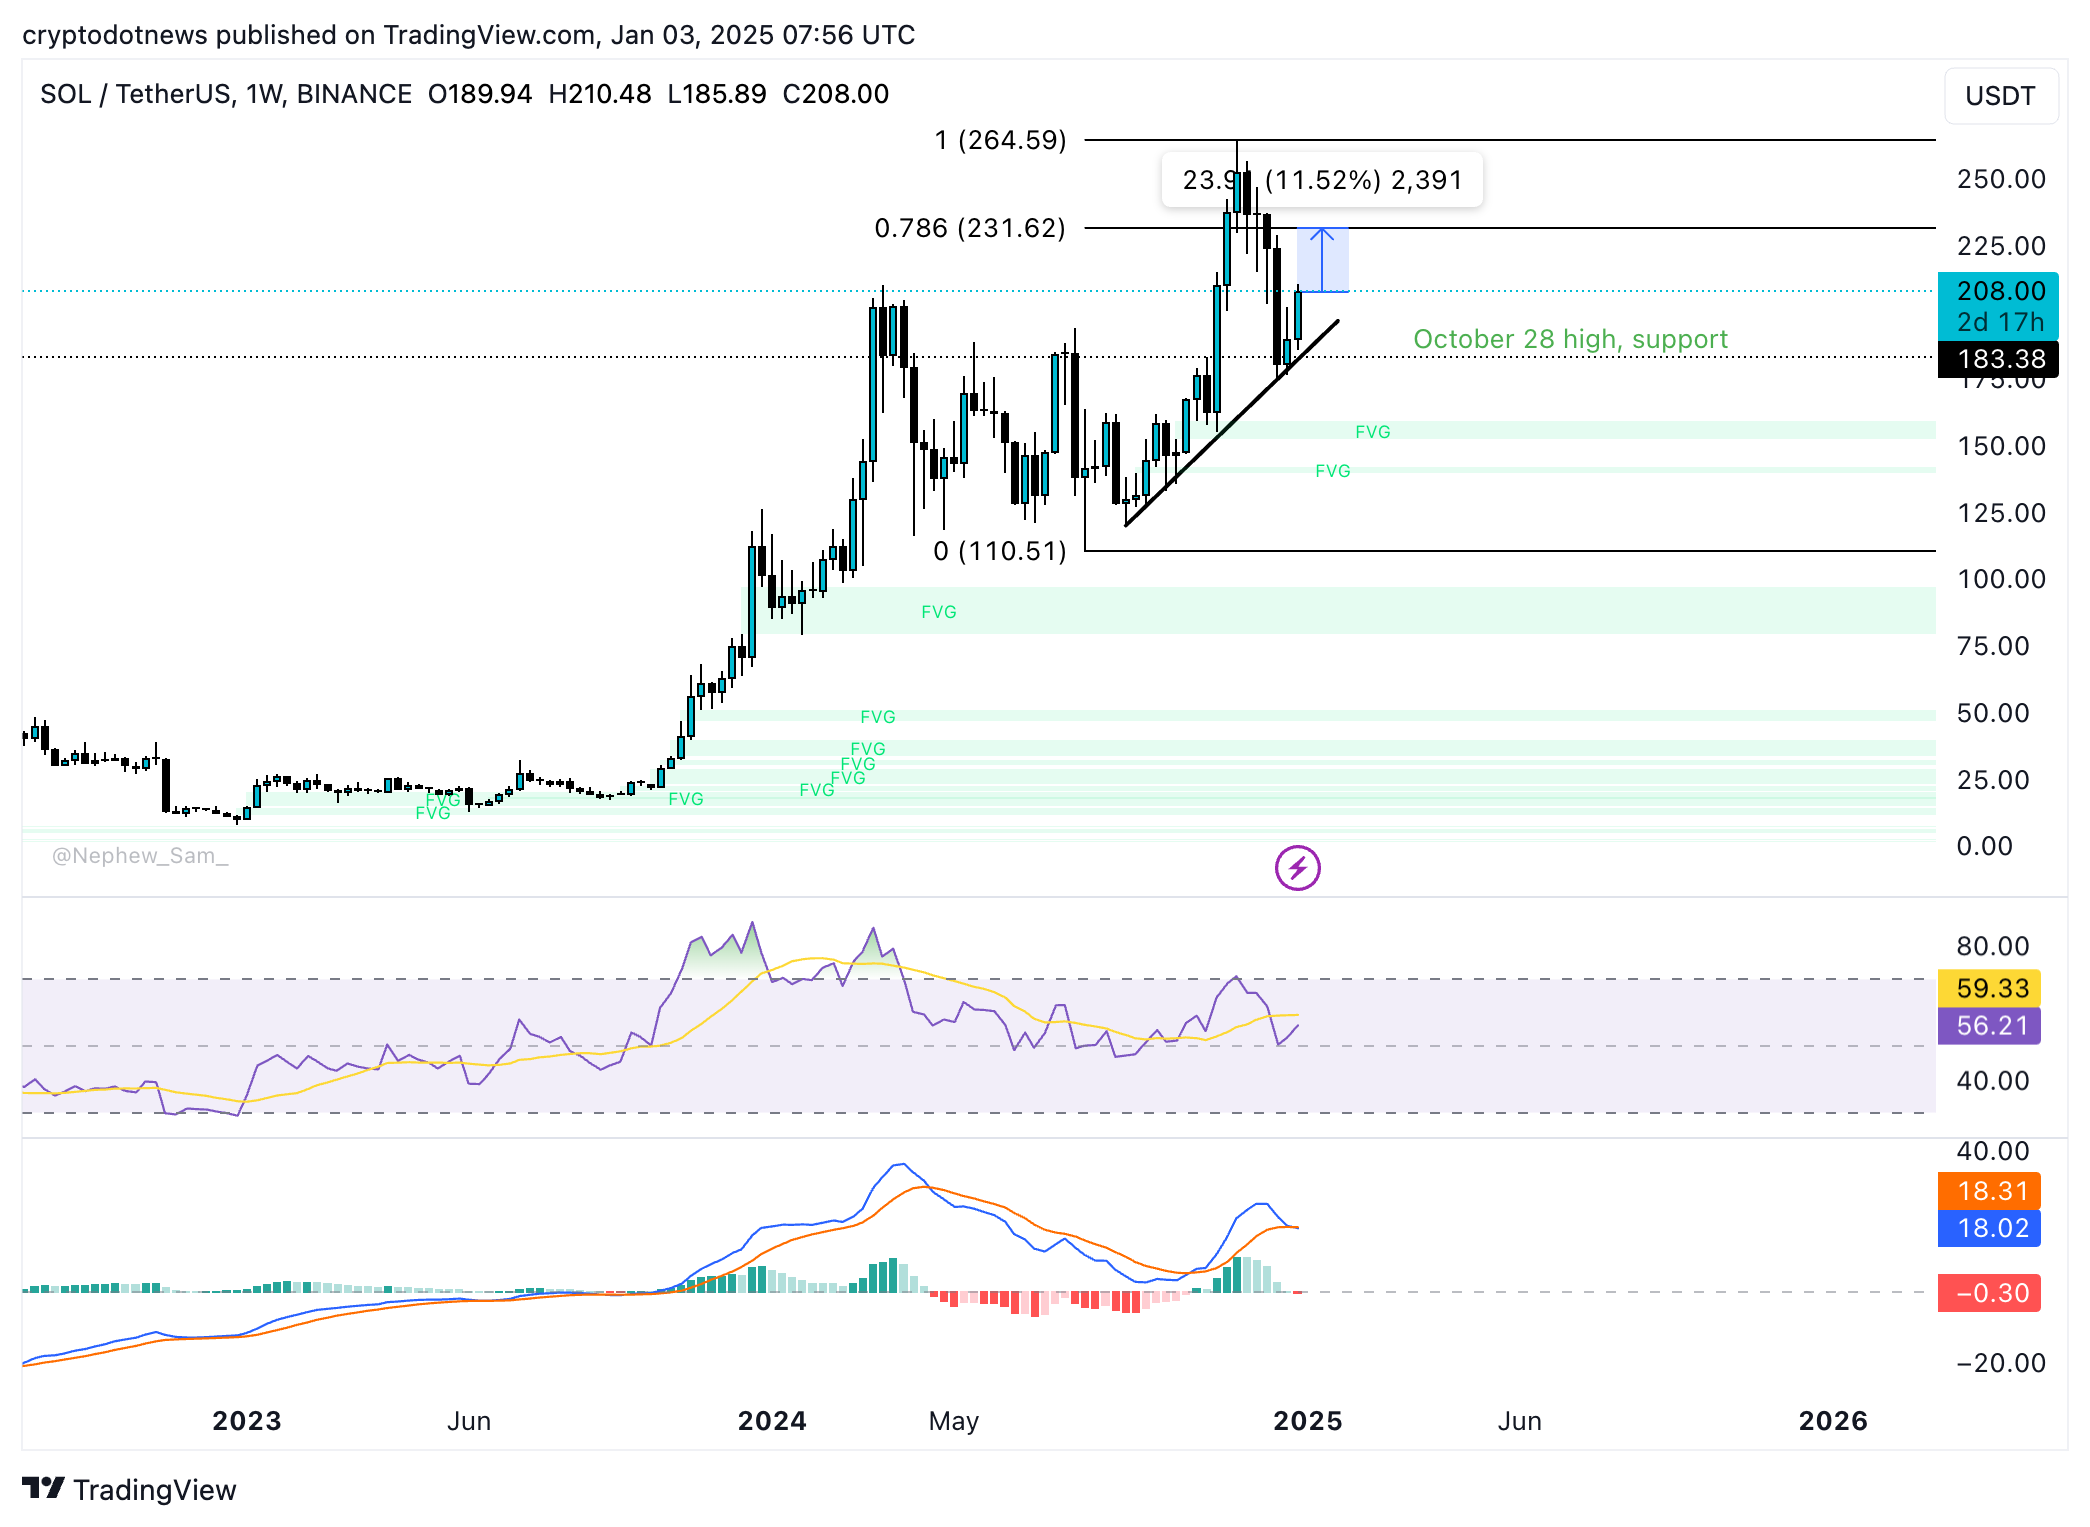
Solana’s weekly chart shows the altcoin in an uptrend and close to $231.62, the 78.6% Fibonacci retracement level of its rally from the $110 low to the $264.59 peak. The $200 level remains a key milestone for SOL.
SOL is currently nearly 12% below the closest resistance, and the October 28 high of $183.38 supports the token. RSI is sloping upwards and reads 56, and MACD shows that the underlying momentum in the SOL price trend may have turned negative.
Pump.fun continues to dump SOL tokens
On-chain analysis from Lookonchain shows that Pump.fun, the launchpad on Solana, continues to offload its SOL token holdings. On January 3, the wallet associated with the launchpad deposited 292,437 SOL (worth over $55 million) to Kraken and sold nearly $42 million worth of SOL tokens.
On Friday, the launchpad’s wallet deposited 63,171 SOL( worth upwards of $13 million) to Kraken.
Pump.fun’s SOL token dump could increase selling pressure on the altcoin if the launchpad doesn’t end its streak soon. Traders need to watch whale activity and Solana supply on exchanges to predict any upcoming correction in SOL price.
Disclosure: This article does not represent investment advice. The content and materials featured on this page are for educational purposes only.

